
Technical weakness persists — The Graph drops 10.47%

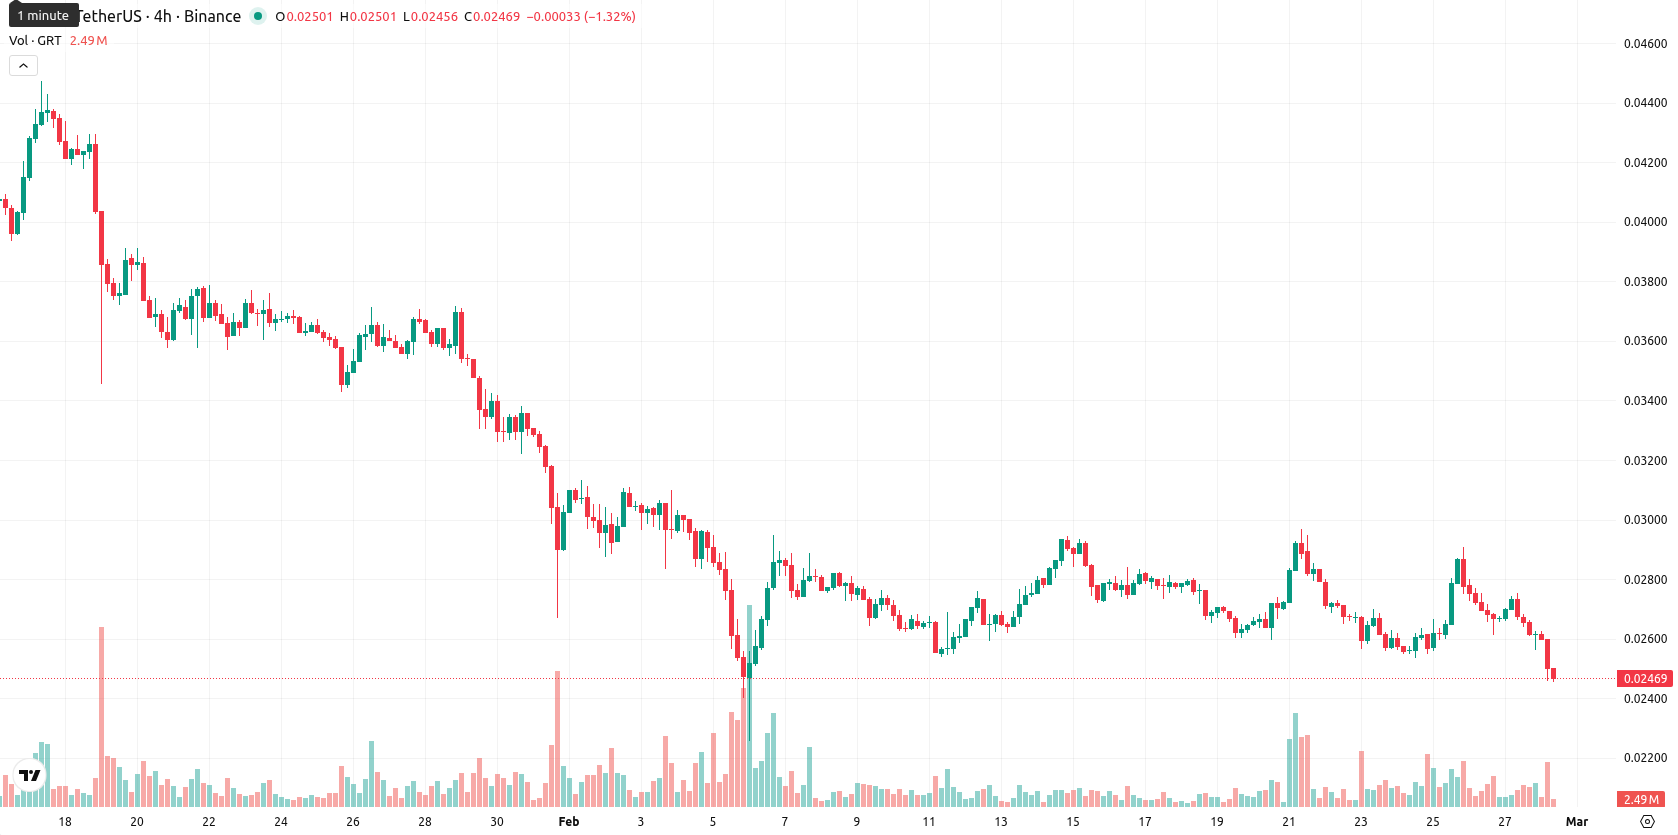
The Graph (GRT) is trading at $0.024594, down 10.47% in the latest session and sharply below its key moving averages, highlighting persistent selling pressure across all timeframes.
Highlights
- GRT trades at $0.024594, sharply below the MA-20, MA-50, and MA-200, evidencing sustained selling pressure across all timeframes.
- Momentum and oscillator indicators including MACD ('Strong Sell'), ADX (32.89), RSI (40.66), and CCI (-78.82) confirm strong bearish conditions with minimal buyer activity.
- The immediate resistance is the Ichimoku Kijun at $0.026820, with a likely 5-day range of $0.0221–$0.0265 and downside risk increasing if $0.0221 is breached.
Bearish trend accelerates as momentum and support erode
GRT remains under sustained technical pressure, with the price firmly beneath the MA-20 ($0.02710450), MA-50 ($0.03246420), and MA-200 ($0.05821720). The Ichimoku Kijun at $0.026820 acts as the immediate resistance. Bearish momentum dominates as the MACD remains on 'Strong Sell,' and the ADX value of 32.89 confirms an active downward trend. The RSI at 40.66, Stochastic RSI at 43.76 (neutral), and CCI at -78.82 indicate that GRT approaches, but is not yet in, oversold territory. Bull/Bear Power is marginally positive, suggesting weak buying amid prevailing seller dominance. Volatility is elevated after a session gap down, with no bullish divergence present across oscillators.
Further downside risk persists as bullish reversal falters
Looking ahead, GRT is expected to consolidate within a typical 5-day volatility band of $0.0221 – $0.0265. The chance of a short-term price increase remains very low (less than 20%), given persistent bearish momentum from all major weekly trend indicators. A breakout above $0.0268 (Ichimoku Kijun) would be required for a bullish reversal, though technicals currently do not support this scenario. Further declines are likely if GRT falls below $0.0221, as momentum strengthens to the downside and oversold conditions could deepen.
Last time, analysts noted that The Graph is trading below its 20-, 50-, and 200-day moving averages with persistent bearish momentum, as confirmed by negative signals from MACD and ADX, while the RSI shows mild weakness and the Stochastic RSI suggests overbought conditions. Immediate resistance is seen at the Ichimoku Kijun, with the price expected to move sideways within a narrow range, and further downside risk dominating the outlook amidst heightened volatility and market uncertainty.


-
 Afghanistan
-
 Albania
-
 Algeria
-
 Angola
-
 Argentina
-
 Armenia
-
 Australia
-
 Austria
-
 Azerbaijan
-
 Bahamas
-
 Bahrain
-
 Bangladesh
-
 Belarus
-
 Belgium
-
 Bolivia
-
 Botswana
-
 Brazil
-
 Brunei
-
 Bulgaria
-
 Cambodia
-
 Cameroon
-
 Canada
-
 Chile
Chile
-
 China
China
-
 Colombia
-
 Congo
Congo
-
 Costa Rica
-
 Cote d'Ivoire
-
 Croatia
-
 Cuba
Cuba
-
 Cyprus
-
 Czechia
-
 DR Congo
-
 Denmark
-
 Dominican Republic
-
 Ecuador
-
 Egypt
Egypt
-
 El Salvador
-
 Estonia
-
 Eswatini
-
 Ethiopia
-
 Finland
-
 France
-
 Georgia
-
 Germany
-
 Ghana
Ghana
-
 Greece
-
 Haiti
Haiti
-
 Hong Kong
-
 Hungary
-
 India
India
-
 Indonesia
-
 Iran, Islamic republic
-
 Iraq
Iraq
-
 Ireland
-
 Israel
-
 Italy
Italy
-
 Jamaica
-
 Japan
Japan
-
 Jordan
-
 Kazakhstan
-
 Kenya
Kenya
-
 Korea
Korea
-
 Kuwait
-
 Kyrgyzstan
-
 Laos
Laos
-
 Latvia
-
 Lebanon
-
 Lesotho
-
 Libya
Libya
-
 Lithuania
-
 Luxembourg
-
 Madagascar
-
 Malaysia
-
 Malta
Malta
-
 Mauritius
-
 Mexico
-
 Moldova
-
 Mongolia
-
 Montenegro
-
 Morocco
-
 Mozambique
-
 Myanmar
-
 Namibia
-
 Nepal
Nepal
-
 Netherlands
-
 New Zealand
-
 Nigeria
-
 North Macedonia
-
 Norway
-
 Oman
Oman
-
 Pakistan
-
 Palestine
-
 Panama
-
 Papua New Guinea
-
 Paraguay
-
 Peru
Peru
-
 Philippines
-
 Poland
-
 Portugal
-
 Puerto Rico
-
 Qatar
Qatar
-
 Reunion
-
 Romania
-
 Rwanda
-
 Saudi Arabia
-
 Serbia
-
 Singapore
-
 Slovakia
-
 Slovenia
-
 Somalia
-
 South Africa
-
 Spain
Spain
-
 Sri Lanka
-
 Sweden
-
 Switzerland
-
 Syria
Syria
-
 Taiwan
-
 Tajikistan
-
 Tanzania
-
 Thailand
-
 Trinidad and Tobago
-
 Tunisia
-
 Turkey
-
 UAE
UAE
-
 Uganda
-
 Ukraine
-
 United Kingdom
-
United States
-
 Uruguay
-
 Uzbekistan
-
 Venezuela
-
 Vietnam
-
 Yemen
Yemen
-
 Zambia
-
 Zimbabwe
- Forex
- Crypto
