
Flow falls 9.98% as technical signals point to extended downside pressure

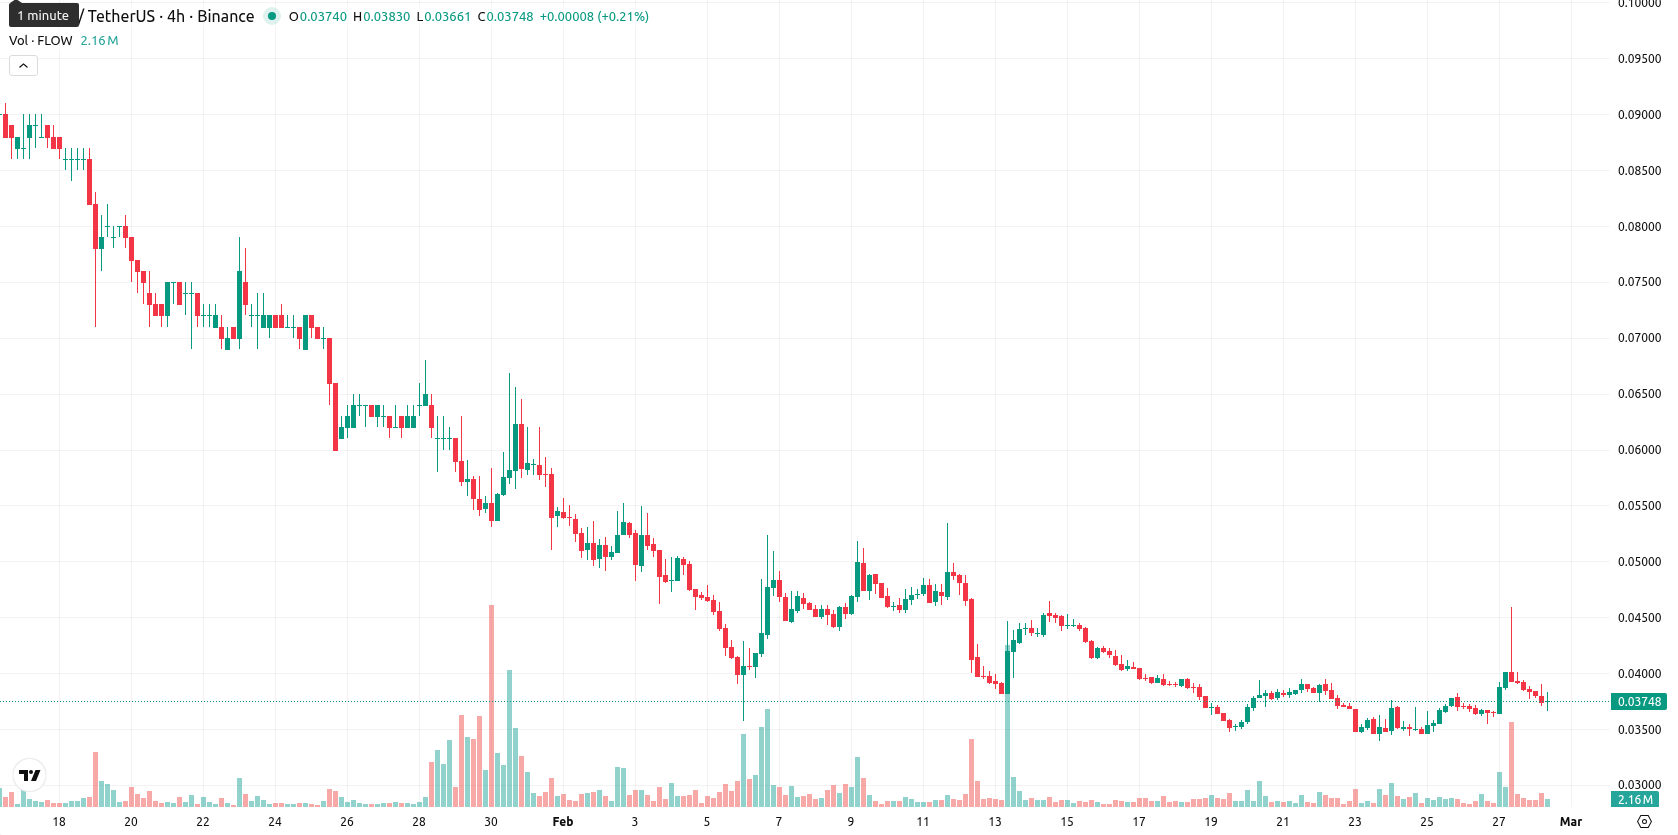
Flow (FLOW) is trading at $0.0379 after declining 9.98% today, positioning the price below its short-, medium-, and long-term moving averages. This reflects persistent downward pressure, with FLOW currently beneath its MA-20 ($0.0402), MA-50 ($0.0574), and MA-200 ($0.2287).
Highlights
- FLOW is trading at $0.0379, below its MA-20 ($0.0402), MA-50 ($0.0574), and MA-200 ($0.2287), indicating entrenched downward pressure across all timeframes.
- Momentum indicators remain firmly bearish—MACD and ADX signal strong downside, RSI is 38, and the price is near today's low with high volatility.
- Next 5-day expected range is $0.0340–$0.0415; breaking above $0.0445 is needed for bullish reversal, while a drop below $0.0340 risks further declines.
Bearish signals persist as resistance and volatility cap upside
Technical signals indicate prevailing downside momentum for FLOW. The Ichimoku Kijun level at $0.0445 serves as immediate resistance to upward moves. MACD and ADX readings remain bearish, the RSI registers at 38 revealing continued weakness, and the Stochastic RSI is at 100, suggesting an overbought status. While Bull/Bear Power and HMA intraday suggest mild buyer dominance, overall direction favors sellers, with FLOW trading near intraday lows amid heightened volatility and no signs of a sustained recovery.
Limited rebound prospects as sellers remain in short-term control
Over the next five sessions, FLOW is likely to oscillate within a volatility band relative to current levels, between $0.0340 and $0.0415. The probability of a substantial upward move is estimated at less than 20%, while a drop below $0.0340 could occur if bearish momentum persists. A breakout above the $0.0445 resistance would be required for any notable bullish reversal, but prevailing daily and weekly technical signals suggest sellers will dominate the short term.
Previously it was reported that Flow (FLOW) is trading well below key moving averages, with pronounced bearish momentum confirmed by strong sell signals from the MACD and ADX, as well as oversold RSI readings across multiple timeframes. The asset remains under persistent selling pressure and volatility, with no immediate support evident and continued weakness as it trades near session lows.


-
 Afghanistan
-
 Albania
-
 Algeria
-
 Angola
-
 Argentina
-
 Armenia
-
 Australia
-
 Austria
-
 Azerbaijan
-
 Bahamas
-
 Bahrain
-
 Bangladesh
-
 Belarus
-
 Belgium
-
 Bolivia
-
 Botswana
-
 Brazil
-
 Brunei
-
 Bulgaria
-
 Cambodia
-
 Cameroon
-
 Canada
-
 Chile
Chile
-
 China
China
-
 Colombia
-
 Congo
Congo
-
 Costa Rica
-
 Cote d'Ivoire
-
 Croatia
-
 Cuba
Cuba
-
 Cyprus
-
 Czechia
-
 DR Congo
-
 Denmark
-
 Dominican Republic
-
 Ecuador
-
 Egypt
Egypt
-
 El Salvador
-
 Estonia
-
 Eswatini
-
 Ethiopia
-
 Finland
-
 France
-
 Georgia
-
 Germany
-
 Ghana
Ghana
-
 Greece
-
 Haiti
Haiti
-
 Hong Kong
-
 Hungary
-
 India
India
-
 Indonesia
-
 Iran, Islamic republic
-
 Iraq
Iraq
-
 Ireland
-
 Israel
-
 Italy
Italy
-
 Jamaica
-
 Japan
Japan
-
 Jordan
-
 Kazakhstan
-
 Kenya
Kenya
-
 Korea
Korea
-
 Kuwait
-
 Kyrgyzstan
-
 Laos
Laos
-
 Latvia
-
 Lebanon
-
 Lesotho
-
 Libya
Libya
-
 Lithuania
-
 Luxembourg
-
 Madagascar
-
 Malaysia
-
 Malta
Malta
-
 Mauritius
-
 Mexico
-
 Moldova
-
 Mongolia
-
 Montenegro
-
 Morocco
-
 Mozambique
-
 Myanmar
-
 Namibia
-
 Nepal
Nepal
-
 Netherlands
-
 New Zealand
-
 Nigeria
-
 North Macedonia
-
 Norway
-
 Oman
Oman
-
 Pakistan
-
 Palestine
-
 Panama
-
 Papua New Guinea
-
 Paraguay
-
 Peru
Peru
-
 Philippines
-
 Poland
-
 Portugal
-
 Puerto Rico
-
 Qatar
Qatar
-
 Reunion
-
 Romania
-
 Rwanda
-
 Saudi Arabia
-
 Serbia
-
 Singapore
-
 Slovakia
-
 Slovenia
-
 Somalia
-
 South Africa
-
 Spain
Spain
-
 Sri Lanka
-
 Sweden
-
 Switzerland
-
 Syria
Syria
-
 Taiwan
-
 Tajikistan
-
 Tanzania
-
 Thailand
-
 Trinidad and Tobago
-
 Tunisia
-
 Turkey
-
 UAE
UAE
-
 Uganda
-
 Ukraine
-
 United Kingdom
-
United States
-
 Uruguay
-
 Uzbekistan
-
 Venezuela
-
 Vietnam
-
 Yemen
Yemen
-
 Zambia
-
 Zimbabwe
- Forex
- Crypto
