
Pudgy Penguins price prediction: Can Pengu Card spark recovery? PENGU drops 10.05%

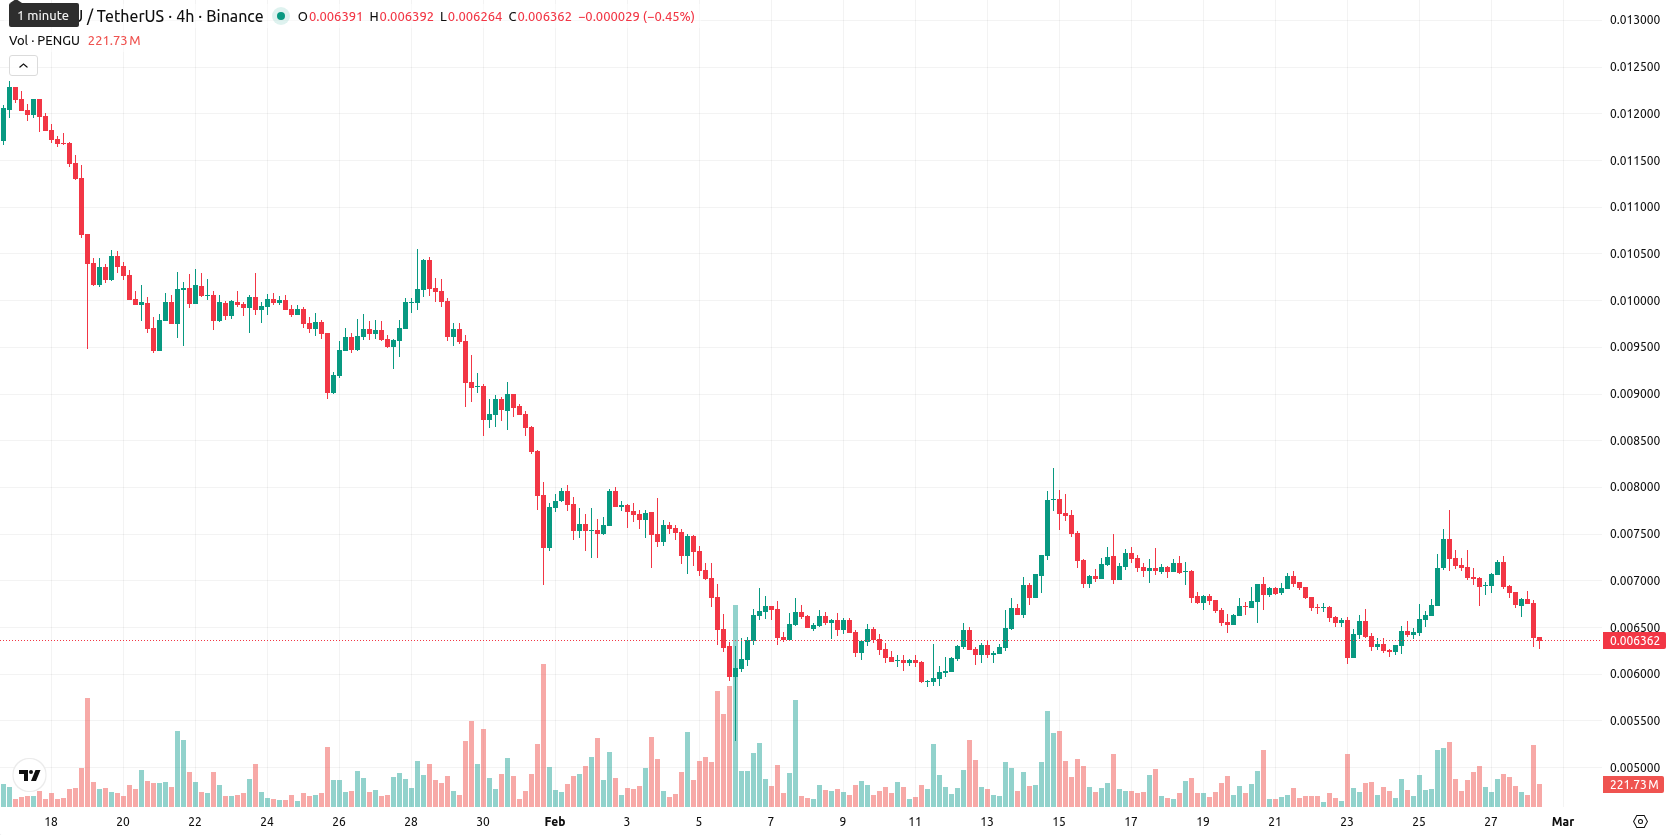
Pudgy Penguins (PENGU) is trading at $0.00633 after slipping 10.05% on the day, remaining below the MA-20 ($0.00674), MA-50 ($0.00858), and MA-200 ($0.01800), which signals persistent downside pressure across all major timeframes.
Highlights
- Pudgy Penguins launched the Pengu Card with Visa, enabling crypto spending at over 150 million merchants and offering up to 12% cashback.
- The PENGU token saw inclusion in ETFs, a 20% volume-to-market-cap ratio, and a 56% surge in trading volume, despite ongoing regulatory and brand risks.
- PENGU trades below all major moving averages, with strong bearish momentum and near-term technical range between $0.00506 (support) and $0.00665 (resistance).
Broader selling prevails despite Visa partnership and institutional interest
Pudgy Penguins entered a new partnership with Visa, launching the Pengu Card to enable crypto spending at over 150 million merchants and up to 12% cashback. Institutional interest was reflected in the inclusion of the PENGU token in ETFs and a reported 20% volume-to-market-cap ratio, accompanied by a 56% increase in recent trading volume. The project is also navigating ongoing regulatory and brand risks as it expands from an NFT focus toward a broader tokenized ecosystem, though price action has remained under broader selling pressure.
Bearish momentum dominates amid resistance at technical thresholds
PENGU remains below key moving averages, with the MA-20 at $0.00674, MA-50 at $0.00858, and MA-200 at $0.01800, while the Ichimoku Kijun at $0.00674 now stands as immediate resistance above the current price. Momentum indicators—including bearish MACD and a firm ADX—signal strong selling pressure, while RSI at 44.96 and Stochastic RSI at 60.42 suggest neutral to mildly bearish conditions with no clear oversold signal. The Commodity Channel Index is neutral, and only Bull/Bear Power offers a mild 'Buy' reading; all other oscillators, particularly MACD, reinforce a dominant bearish outlook. Price is currently near its session low following a sharp 10.05% loss, with high volatility and persistent intraday selling confirming the session's bearish tone.
Further losses favored as rebound odds remain low
For the next five trading days, PENGU is expected to fluctuate within a typical volatility band between $0.00506 and $0.00665. The probability of a price increase is low (less than 20%), making further downside movement more likely. The base scenario projects sideways consolidation between $0.00506 and $0.00665; a breakout above $0.00674 could prompt a move to the top of the range. A fall below $0.00506 may accelerate declines toward new lows.
Previously it was reported that Pudgy Penguins (PENGU) is trading below its key moving averages and facing persistent bearish momentum, with the price encountering dynamic resistance near the Ichimoku Kijun and lacking substantial near-term support. Momentum indicators such as MACD and ADX confirm ongoing selling pressure, while RSI and Stoch RSI readings indicate the token is not yet oversold, suggesting continued downside risk within a predominantly bearish technical setup.


-
 Afghanistan
-
 Albania
-
 Algeria
-
 Angola
-
 Argentina
-
 Armenia
-
 Australia
-
 Austria
-
 Azerbaijan
-
 Bahamas
-
 Bahrain
-
 Bangladesh
-
 Belarus
-
 Belgium
-
 Bolivia
-
 Botswana
-
 Brazil
-
 Brunei
-
 Bulgaria
-
 Cambodia
-
 Cameroon
-
 Canada
-
 Chile
Chile
-
 China
China
-
 Colombia
-
 Congo
Congo
-
 Costa Rica
-
 Cote d'Ivoire
-
 Croatia
-
 Cuba
Cuba
-
 Cyprus
-
 Czechia
-
 DR Congo
-
 Denmark
-
 Dominican Republic
-
 Ecuador
-
 Egypt
Egypt
-
 El Salvador
-
 Estonia
-
 Eswatini
-
 Ethiopia
-
 Finland
-
 France
-
 Georgia
-
 Germany
-
 Ghana
Ghana
-
 Greece
-
 Haiti
Haiti
-
 Hong Kong
-
 Hungary
-
 India
India
-
 Indonesia
-
 Iran, Islamic republic
-
 Iraq
Iraq
-
 Ireland
-
 Israel
-
 Italy
Italy
-
 Jamaica
-
 Japan
Japan
-
 Jordan
-
 Kazakhstan
-
 Kenya
Kenya
-
 Korea
Korea
-
 Kuwait
-
 Kyrgyzstan
-
 Laos
Laos
-
 Latvia
-
 Lebanon
-
 Lesotho
-
 Libya
Libya
-
 Lithuania
-
 Luxembourg
-
 Madagascar
-
 Malaysia
-
 Malta
Malta
-
 Mauritius
-
 Mexico
-
 Moldova
-
 Mongolia
-
 Montenegro
-
 Morocco
-
 Mozambique
-
 Myanmar
-
 Namibia
-
 Nepal
Nepal
-
 Netherlands
-
 New Zealand
-
 Nigeria
-
 North Macedonia
-
 Norway
-
 Oman
Oman
-
 Pakistan
-
 Palestine
-
 Panama
-
 Papua New Guinea
-
 Paraguay
-
 Peru
Peru
-
 Philippines
-
 Poland
-
 Portugal
-
 Puerto Rico
-
 Qatar
Qatar
-
 Reunion
-
 Romania
-
 Rwanda
-
 Saudi Arabia
-
 Serbia
-
 Singapore
-
 Slovakia
-
 Slovenia
-
 Somalia
-
 South Africa
-
 Spain
Spain
-
 Sri Lanka
-
 Sweden
-
 Switzerland
-
 Syria
Syria
-
 Taiwan
-
 Tajikistan
-
 Tanzania
-
 Thailand
-
 Trinidad and Tobago
-
 Tunisia
-
 Turkey
-
 UAE
UAE
-
 Uganda
-
 Ukraine
-
 United Kingdom
-
United States
-
 Uruguay
-
 Uzbekistan
-
 Venezuela
-
 Vietnam
-
 Yemen
Yemen
-
 Zambia
-
 Zimbabwe
- Forex
- Crypto
