
Solana price prediction: Will ETF inflows and network expansion stem losses? SOL drops below key averages

Solana (SOL) is trading at $84.16, registering a daily decline of 3.56%. The asset is situated just above the MA-20 ($83.40) but well below the MA-50 ($104.78) and MA-200 ($156.87), indicating stabilization in the short term with prevailing downward pressure from medium- and long-term trends.
SOL price prediction
Current price:
$ 71.04
2.26
3.29%
Real-time Data
13:39
Daily range
69.48
 72.3
72.3
Weekly range
66.94
76.09
Loading...
Highlights
- U.S. spot Solana ETFs attracted $44 million in inflows last week, with a $30.86 million influx on Wednesday, signaling growing institutional interest.
- SoFi became the first U.S. bank to support direct Solana deposits, and Payments.org launched, boosting Solana's mainstream accessibility amid rising network engagement.
- Technically, Solana trades at $84.16, slightly above MA-20 but below key longer-term averages, with negative momentum signals and high probability of further downside toward $80–$88.
Mainstream adoption and ETF inflows as retail activity drops
Institutional support for Solana was reported as U.S. spot Solana ETFs saw an inflow of approximately $44 million last week, including $30.86 million in daily inflows on Wednesday. Payments.org was launched and SoFi became the first U.S. bank to support direct Solana deposits, expanding the asset’s mainstream accessibility. On-chain data showed network engagement rising, with daily new addresses increasing by 1.4 million over 12 days to 8.6 million. These developments were accompanied by lower retail activity on decentralized exchanges and a period of broad market volatility, though price action has remained under broader selling pressure.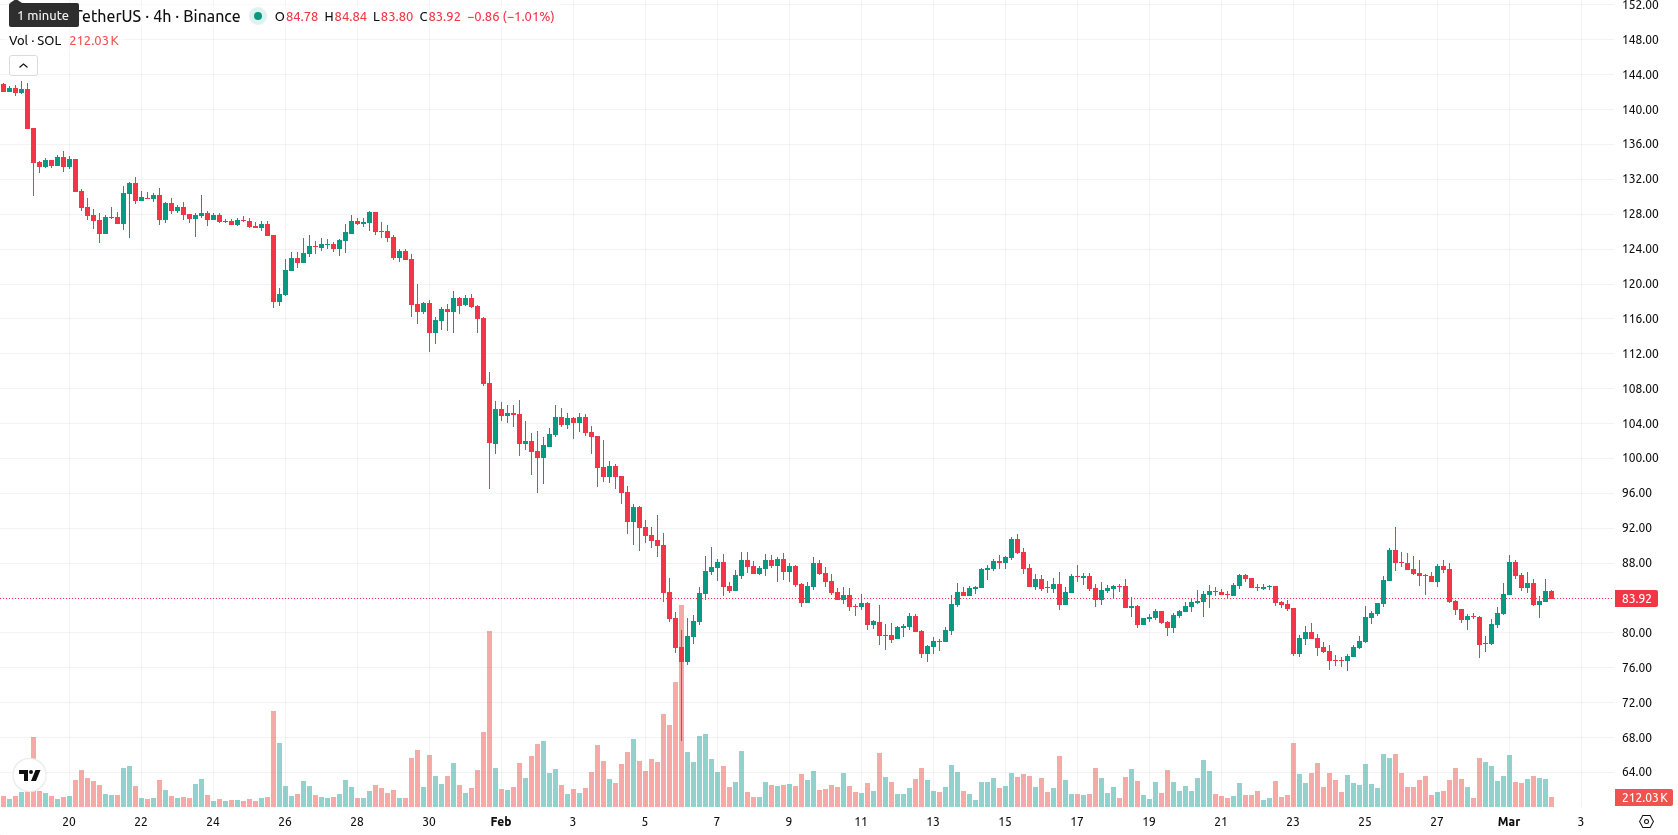
Divergent momentum and technical support amid persistent seller control
At the current price of $84.16, Solana is trading slightly above the MA-20 ($83.40) but remains well below the MA-50 ($104.78) and MA-200 ($156.87). This setup suggests short-term stabilization, while medium- and long-term trends indicate sustained pressure from sellers. The Ichimoku Kijun is at $83.59, positioning it just below the current price and serving as immediate support. Momentum signals are negative, with the MACD showing a strong sell and the ADX indicating a sustained downtrend. The RSI is in bearish territory, while the Stochastic RSI and CCI provide a mix of oversold and neutral readings. Bull/Bear Power is overbought, suggesting buyers have pushed aggressively, but with a daily drop of 3.56% from the previous close and no gap at the open, the current price sits near the lower end of today’s range ($83.52–$86.16). Despite moderate volatility, there is evident downside pressure after the open. Notably, there is a divergence between oscillators and momentum indicators, highlighting short-term buyer attempts in an overall bearish framework.Sideways movement likely as sell signals persist
Over the next five trading days, Solana is expected to remain within a typical volatility band between $80 and $88, in line with current price levels. The probability of a price increase is low (less than 20%), while ongoing sell signals across moving average, RSI, ADX, and MACD raise the risk of a further decline. The baseline scenario is for sideways price movement within this range. A bullish surprise could lift the price above immediate resistance, but a breakdown below near-term support appears more likely if selling pressure continues.
Anton Kharitonov, expert at Traders Union, sees Solana struggling below key moving averages and under persistent selling pressure. He notes that recent institutional inflows and adoption gains have not been enough to shift the dominant bearish technical picture. Momentum and oscillators remain negative, suggesting limited chances of meaningful upside in the short term. "The setup is still weak — until $88 is reclaimed on strength, I remain defensive on Solana," Kharitonov says.
Last time, analysts noted that SoFi became the first federally licensed national bank to directly integrate Solana for on-chain transfers, enabling users to send SOL from external wallets straight into their banking accounts. This development marks a shift in the trend of digital asset integration among US banks, signaling increased institutional interest and narrowing the operational gap between traditional finance and public blockchains.
Source of Data:
SOL Price Analysis by TU
The analysis is based on a proprietary model combining technical, on-chain, and expert data. Not investment advice. See
methodology
The information is based on forecasts and does not constitute investment advice or a guarantee of future results. Market conditions may change. See our Disclaimer and Editorial Integrity for details.
Subscribe to TU news

Did you like the article?


Latest Solana News


Weekly Top Bonuses

Top News


Top 5 companies for you

United States
-
 Afghanistan
-
 Albania
-
 Algeria
-
 Angola
-
 Argentina
-
 Armenia
-
 Australia
-
 Austria
-
 Azerbaijan
-
 Bahamas
-
 Bahrain
-
 Bangladesh
-
 Belarus
-
 Belgium
-
 Bolivia
-
 Botswana
-
 Brazil
-
 Brunei
-
 Bulgaria
-
 Cambodia
-
 Cameroon
-
 Canada
-
 Chile
Chile
-
 China
China
-
 Colombia
-
 Congo
Congo
-
 Costa Rica
-
 Cote d'Ivoire
-
 Croatia
-
 Cuba
Cuba
-
 Cyprus
-
 Czechia
-
 DR Congo
-
 Denmark
-
 Dominican Republic
-
 Ecuador
-
 Egypt
Egypt
-
 El Salvador
-
 Estonia
-
 Eswatini
-
 Ethiopia
-
 Finland
-
 France
-
 Georgia
-
 Germany
-
 Ghana
Ghana
-
 Greece
-
 Haiti
Haiti
-
 Hong Kong
-
 Hungary
-
 India
India
-
 Indonesia
-
 Iran, Islamic republic
-
 Iraq
Iraq
-
 Ireland
-
 Israel
-
 Italy
Italy
-
 Jamaica
-
 Japan
Japan
-
 Jordan
-
 Kazakhstan
-
 Kenya
Kenya
-
 Korea
Korea
-
 Kuwait
-
 Kyrgyzstan
-
 Laos
Laos
-
 Latvia
-
 Lebanon
-
 Lesotho
-
 Libya
Libya
-
 Lithuania
-
 Luxembourg
-
 Madagascar
-
 Malaysia
-
 Malta
Malta
-
 Mauritius
-
 Mexico
-
 Moldova
-
 Mongolia
-
 Montenegro
-
 Morocco
-
 Mozambique
-
 Myanmar
-
 Namibia
-
 Nepal
Nepal
-
 Netherlands
-
 New Zealand
-
 Nigeria
-
 North Macedonia
-
 Norway
-
 Oman
Oman
-
 Pakistan
-
 Palestine
-
 Panama
-
 Papua New Guinea
-
 Paraguay
-
 Peru
Peru
-
 Philippines
-
 Poland
-
 Portugal
-
 Puerto Rico
-
 Qatar
Qatar
-
 Reunion
-
 Romania
-
 Rwanda
-
 Saudi Arabia
-
 Serbia
-
 Singapore
-
 Slovakia
-
 Slovenia
-
 Somalia
-
 South Africa
-
 Spain
Spain
-
 Sri Lanka
-
 Sweden
-
 Switzerland
-
 Syria
Syria
-
 Taiwan
-
 Tajikistan
-
 Tanzania
-
 Thailand
-
 Trinidad and Tobago
-
 Tunisia
-
 Turkey
-
 UAE
UAE
-
 Uganda
-
 Ukraine
-
 United Kingdom
-
United States
-
 Uruguay
-
 Uzbekistan
-
 Venezuela
-
 Vietnam
-
 Yemen
Yemen
-
 Zambia
-
 Zimbabwe
- Forex
- Crypto
Live News
