
PEPE trades lower with downside risk prevailing as weekly indicators forecast continued range-bound movement – weekly report

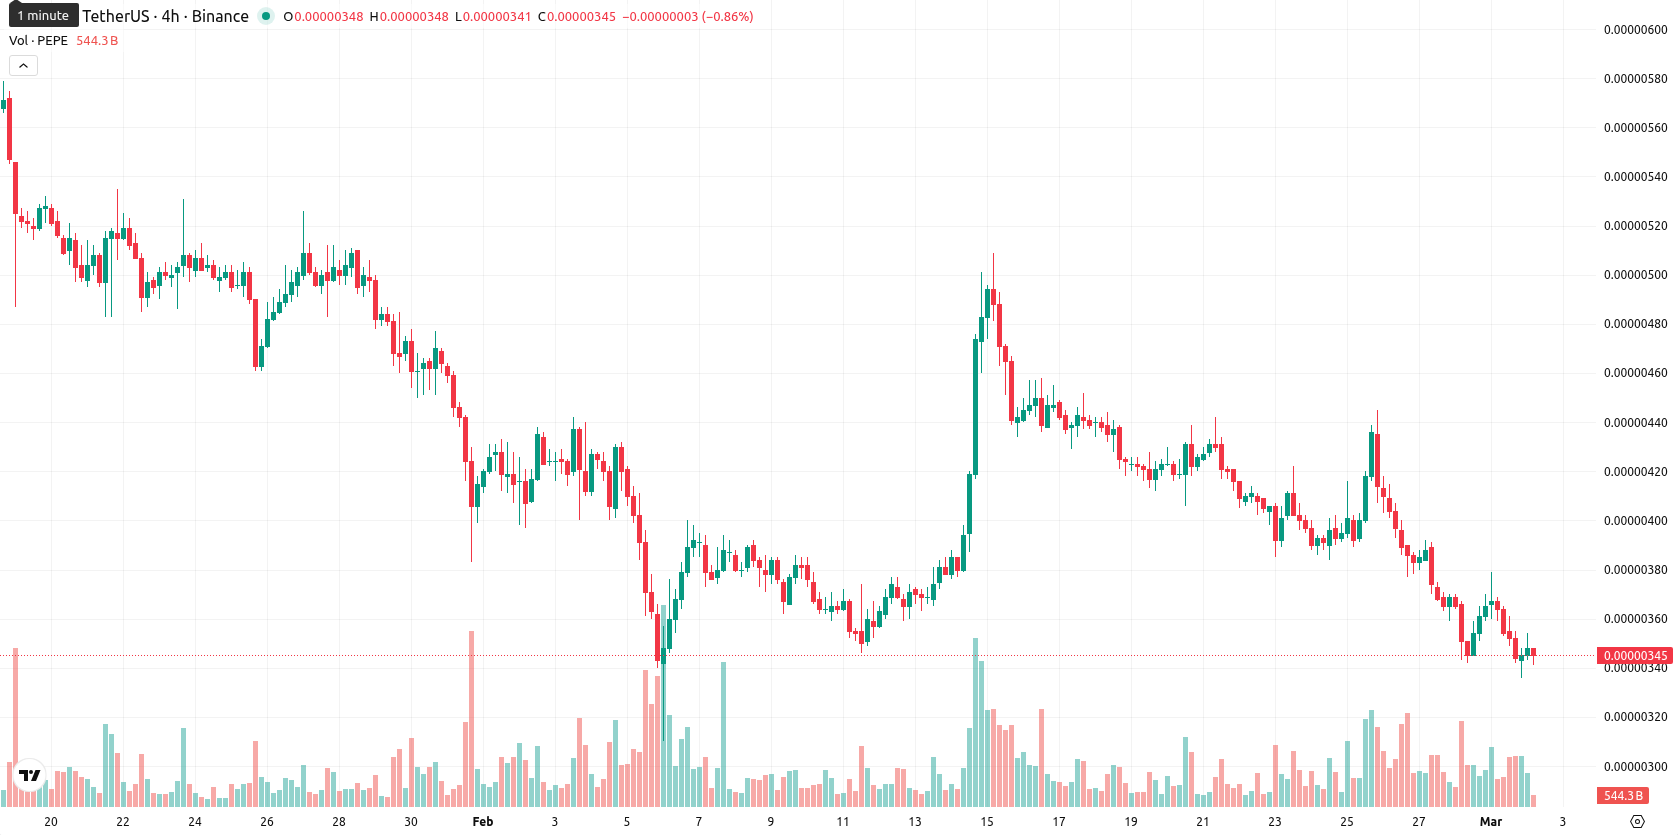
Pepe (PEPE) is currently trading at $0.0000034 after a weekly decline, down 6.27% over the last seven days. The price has held beneath the key MA-20, MA-50, and MA-200 weekly moving averages, highlighting sustained bearish momentum on the W1 timeframe.
Highlights
- PEPE trades at $0.0000034, remaining below the MA-20, MA-50, and MA-200, signaling persistent short- and long-term bearish pressure.
- Oscillators show oversold conditions (RSI 34.8, Stochastic RSI 0.0, CCI -117), yet momentum indicators and negative Bull/Bear Power suggest continued seller dominance.
- Expected five-day price range is $0.00000306–$0.00000374 with over 80% probability of further decline, and key resistance at the Ichimoku Kijun ($0.00000410).
Pepeto project launch and staking rewards fuel meme coin sector activity
A new project called Pepeto, which is connected to a former cofounder of Pepe, recently completed a presale raising over $7.39 million at a price of $0.000000186 per token. Pepeto has announced three new product launches aimed at meme coin infrastructure, including PepetoSwap, a cross-chain decentralized exchange, an Ethereum-BSC-Solana bridge, and a dedicated meme coin exchange. The project completed dual audits and has already activated staking with annualized rewards over 210% APY for early participants.
Downward momentum persists as technical indicators reinforce bearish pressure
Weekly technical signals remain negative for PEPE, with the price below all major W1 moving averages (MA-20 at $0.00000402, MA-50 at $0.00000454, MA-200 at $0.00000657). Dynamic resistance sits at the Ichimoku Kijun of $0.00000410, while no meaningful support is provided by moving averages near the current price. Momentum indicators continue to point to a bearish structure: W1 RSI is oversold at 34.8, Stochastic RSI is at 0.0, CCI reads -117, and the MACD plus ADX both show weak and negative direction. The Awesome Oscillator also confirms the prevalence of downward pressure.
Downside risk prevails with range-bound bias forecast for next week
Over the next five to seven trading days, weekly indicators signal that PEPE will likely remain range-bound, with an expected price corridor between $0.00000306 and $0.00000374. Downside risk prevails, and the probability of a further decline remains above 80% unless a sharp rebound drives price above the Ichimoku Kijun at $0.00000410. The base case scenario is continued sideways movement within this narrow range, while an acceleration of selling could push the price below the lower boundary at $0.00000306.
Previously it was reported that PEPE continues to trade below all major moving averages with technical indicators, including MACD and RSI, reinforcing persistent bearish momentum and oversold conditions. Immediate resistance is seen at $0.00000410, with further downside likely if price falls below the $0.0000030 support, as no technical signs of a reversal have emerged.


-
 Afghanistan
-
 Albania
-
 Algeria
-
 Angola
-
 Argentina
-
 Armenia
-
 Australia
-
 Austria
-
 Azerbaijan
-
 Bahamas
-
 Bahrain
-
 Bangladesh
-
 Belarus
-
 Belgium
-
 Bolivia
-
 Botswana
-
 Brazil
-
 Brunei
-
 Bulgaria
-
 Cambodia
-
 Cameroon
-
 Canada
-
 Chile
Chile
-
 China
China
-
 Colombia
-
 Congo
Congo
-
 Costa Rica
-
 Cote d'Ivoire
-
 Croatia
-
 Cuba
Cuba
-
 Cyprus
-
 Czechia
-
 DR Congo
-
 Denmark
-
 Dominican Republic
-
 Ecuador
-
 Egypt
Egypt
-
 El Salvador
-
 Estonia
-
 Eswatini
-
 Ethiopia
-
 Finland
-
 France
-
 Georgia
-
 Germany
-
 Ghana
Ghana
-
 Greece
-
 Haiti
Haiti
-
 Hong Kong
-
 Hungary
-
 India
India
-
 Indonesia
-
 Iran, Islamic republic
-
 Iraq
Iraq
-
 Ireland
-
 Israel
-
 Italy
Italy
-
 Jamaica
-
 Japan
Japan
-
 Jordan
-
 Kazakhstan
-
 Kenya
Kenya
-
 Korea
Korea
-
 Kuwait
-
 Kyrgyzstan
-
 Laos
Laos
-
 Latvia
-
 Lebanon
-
 Lesotho
-
 Libya
Libya
-
 Lithuania
-
 Luxembourg
-
 Madagascar
-
 Malaysia
-
 Malta
Malta
-
 Mauritius
-
 Mexico
-
 Moldova
-
 Mongolia
-
 Montenegro
-
 Morocco
-
 Mozambique
-
 Myanmar
-
 Namibia
-
 Nepal
Nepal
-
 Netherlands
-
 New Zealand
-
 Nigeria
-
 North Macedonia
-
 Norway
-
 Oman
Oman
-
 Pakistan
-
 Palestine
-
 Panama
-
 Papua New Guinea
-
 Paraguay
-
 Peru
Peru
-
 Philippines
-
 Poland
-
 Portugal
-
 Puerto Rico
-
 Qatar
Qatar
-
 Reunion
-
 Romania
-
 Rwanda
-
 Saudi Arabia
-
 Serbia
-
 Singapore
-
 Slovakia
-
 Slovenia
-
 Somalia
-
 South Africa
-
 Spain
Spain
-
 Sri Lanka
-
 Sweden
-
 Switzerland
-
 Syria
Syria
-
 Taiwan
-
 Tajikistan
-
 Tanzania
-
 Thailand
-
 Trinidad and Tobago
-
 Tunisia
-
 Turkey
-
 UAE
UAE
-
 Uganda
-
 Ukraine
-
 United Kingdom
-
United States
-
 Uruguay
-
 Uzbekistan
-
 Venezuela
-
 Vietnam
-
 Yemen
Yemen
-
 Zambia
-
 Zimbabwe
- Forex
- Crypto
