
-7.16% for Pepe — Price slips below major moving averages with sellers in control

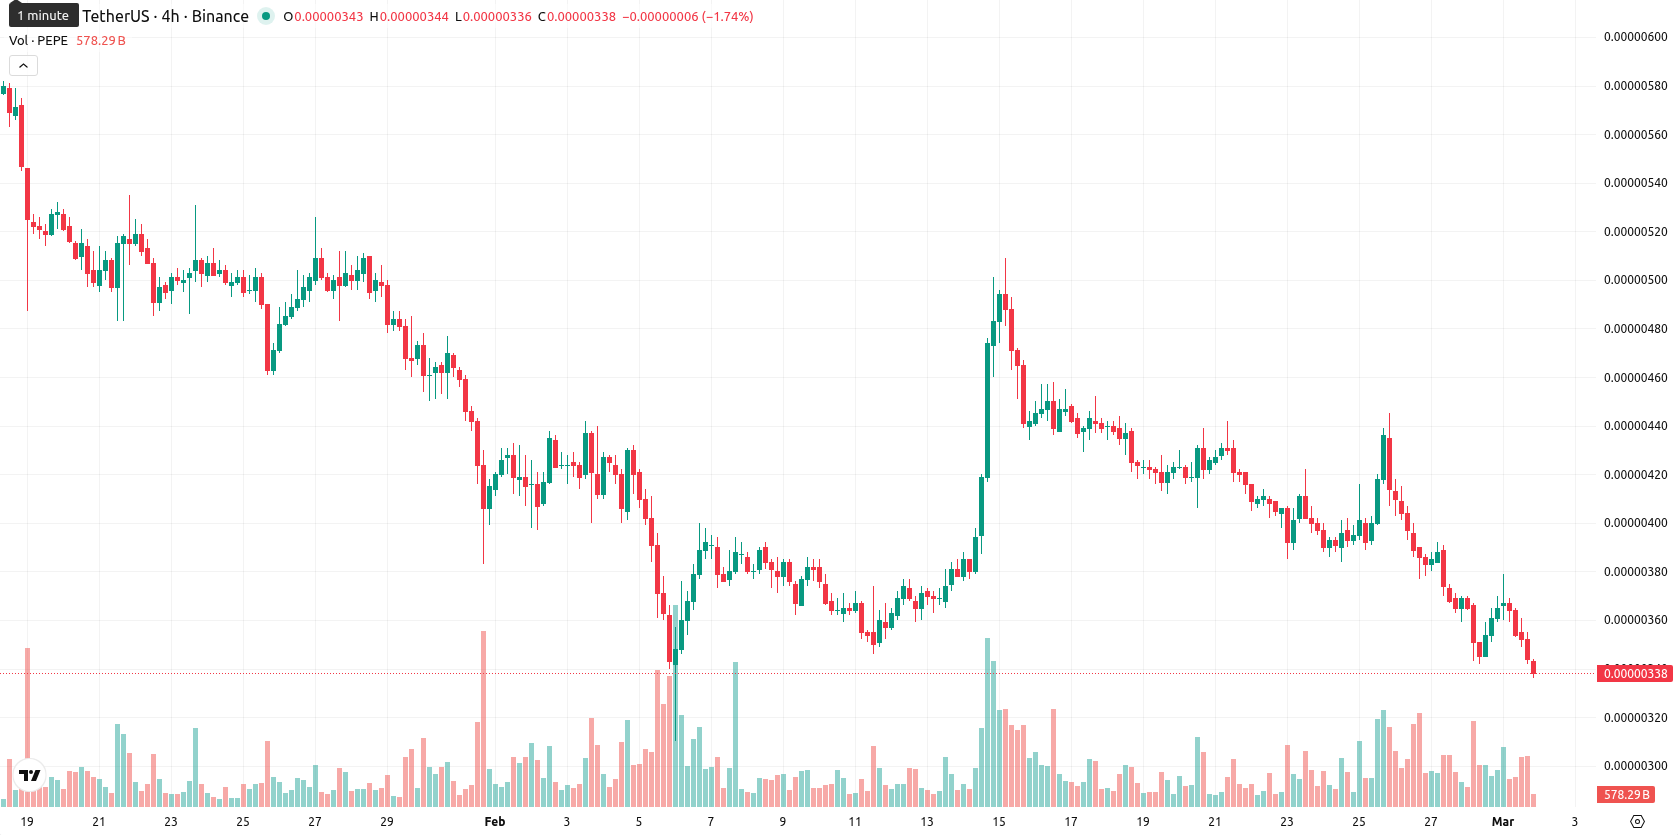
Pepe (PEPE) is trading at $0.0000034, marking a daily decline of 7.16%. The price is below the short-, medium-, and long-term moving averages, with MA-20 at $0.00000404, MA-50 at $0.00000459, and MA-200 at $0.00000662, reinforcing prevailing downside pressure.
Highlights
- PEPE’s associated Pepeto project surpassed $7,369,000 in presale funding at $0.000000186 per token, with over 70% of the presale completed and multiple product demos launched.
- A staking program offering a 211% APY and dual smart contract audits contributed to rising participation from whales ahead of the initial exchange listing, despite ongoing market selling pressure.
- PEPE trades at $0.0000034, well below MA-20, MA-50, and MA-200, with immediate resistance at $0.00000410 and a heightened risk of further downside as technicals remain bearish.
Whale interest rises as Pepeto presale nears completion
PEPE reported progress in its related project with Pepeto surpassing $7,369,000 in presale funding at a rate of $0.000000186 per token, with over 70% of the presale completed. Three product demos were launched for PepetoSwap, Pepeto Bridge, and Pepeto Exchange, while a staking program with a 211% APY was introduced and continued uninterrupted during recent market volatility. Presale tokens were insulated from exchange liquidations, and dual audits were completed; increased participation from whales and market entrants was noted as the token neared initial exchange listing, though price action has remained under broader selling pressure.
Bearish momentum persists as all technical signals align lower
PEPE remains under sustained selling activity, with current price action below the MA-20, MA-50, and MA-200, highlighting weakness across all trending periods. The Ichimoku Kijun at $0.00000410 provides immediate resistance. Technical indicators reinforce a bearish outlook, as the MACD signals sell, the ADX is neutral to weak, and the RSI (daily at 38.58 and weekly at 38.17), along with the Stochastic RSI and Commodity Channel Index, reflect oversold conditions without any strong reversal signs. Bull/Bear Power confirms dominant seller control intraday, with the Awesome Oscillator supporting the downside trend.
Further declines likely as oscillators and ranges skew negative
For the coming week, PEPE is expected to trade within a typical volatility band of $0.0000030 – $0.0000036. Probabilities favor further declines over a sustained bounce, as bearish signals from both moving averages and oscillators persist. The base case sees price consolidating within this range. A bullish scenario would require a move above immediate resistance at $0.0000041, while a drop below $0.0000030 could confirm additional downward momentum.
Last time, analysts noted that Pepe (PEPE) remained under strong bearish control, trading well below its key moving averages with persistent negative momentum signaled by indicators such as MACD, ADX, and RSI. Ongoing downside pressure is reinforced by oversold technical readings and high volatility, with support identified at $0.0000032 and resistance at $0.00000410, while no signs of a bullish reversal are yet apparent.


Latest PEPE/USD News


-
 Afghanistan
-
 Albania
-
 Algeria
-
 Angola
-
 Argentina
-
 Armenia
-
 Australia
-
 Austria
-
 Azerbaijan
-
 Bahamas
-
 Bahrain
-
 Bangladesh
-
 Belarus
-
 Belgium
-
 Bolivia
-
 Botswana
-
 Brazil
-
 Brunei
-
 Bulgaria
-
 Cambodia
-
 Cameroon
-
 Canada
-
 Chile
Chile
-
 China
China
-
 Colombia
-
 Congo
Congo
-
 Costa Rica
-
 Cote d'Ivoire
-
 Croatia
-
 Cuba
Cuba
-
 Cyprus
-
 Czechia
-
 DR Congo
-
 Denmark
-
 Dominican Republic
-
 Ecuador
-
 Egypt
Egypt
-
 El Salvador
-
 Estonia
-
 Eswatini
-
 Ethiopia
-
 Finland
-
 France
-
 Georgia
-
 Germany
-
 Ghana
Ghana
-
 Greece
-
 Haiti
Haiti
-
 Hong Kong
-
 Hungary
-
 India
India
-
 Indonesia
-
 Iran, Islamic republic
-
 Iraq
Iraq
-
 Ireland
-
 Israel
-
 Italy
Italy
-
 Jamaica
-
 Japan
Japan
-
 Jordan
-
 Kazakhstan
-
 Kenya
Kenya
-
 Korea
Korea
-
 Kuwait
-
 Kyrgyzstan
-
 Laos
Laos
-
 Latvia
-
 Lebanon
-
 Lesotho
-
 Libya
Libya
-
 Lithuania
-
 Luxembourg
-
 Madagascar
-
 Malaysia
-
 Malta
Malta
-
 Mauritius
-
 Mexico
-
 Moldova
-
 Mongolia
-
 Montenegro
-
 Morocco
-
 Mozambique
-
 Myanmar
-
 Namibia
-
 Nepal
Nepal
-
 Netherlands
-
 New Zealand
-
 Nigeria
-
 North Macedonia
-
 Norway
-
 Oman
Oman
-
 Pakistan
-
 Palestine
-
 Panama
-
 Papua New Guinea
-
 Paraguay
-
 Peru
Peru
-
 Philippines
-
 Poland
-
 Portugal
-
 Puerto Rico
-
 Qatar
Qatar
-
 Reunion
-
 Romania
-
 Rwanda
-
 Saudi Arabia
-
 Serbia
-
 Singapore
-
 Slovakia
-
 Slovenia
-
 Somalia
-
 South Africa
-
 Spain
Spain
-
 Sri Lanka
-
 Sweden
-
 Switzerland
-
 Syria
Syria
-
 Taiwan
-
 Tajikistan
-
 Tanzania
-
 Thailand
-
 Trinidad and Tobago
-
 Tunisia
-
 Turkey
-
 UAE
UAE
-
 Uganda
-
 Ukraine
-
 United Kingdom
-
United States
-
 Uruguay
-
 Uzbekistan
-
 Venezuela
-
 Vietnam
-
 Yemen
Yemen
-
 Zambia
-
 Zimbabwe
- Forex
- Crypto
