
SEC settlement with Rainberry — Solana slips 4.53%

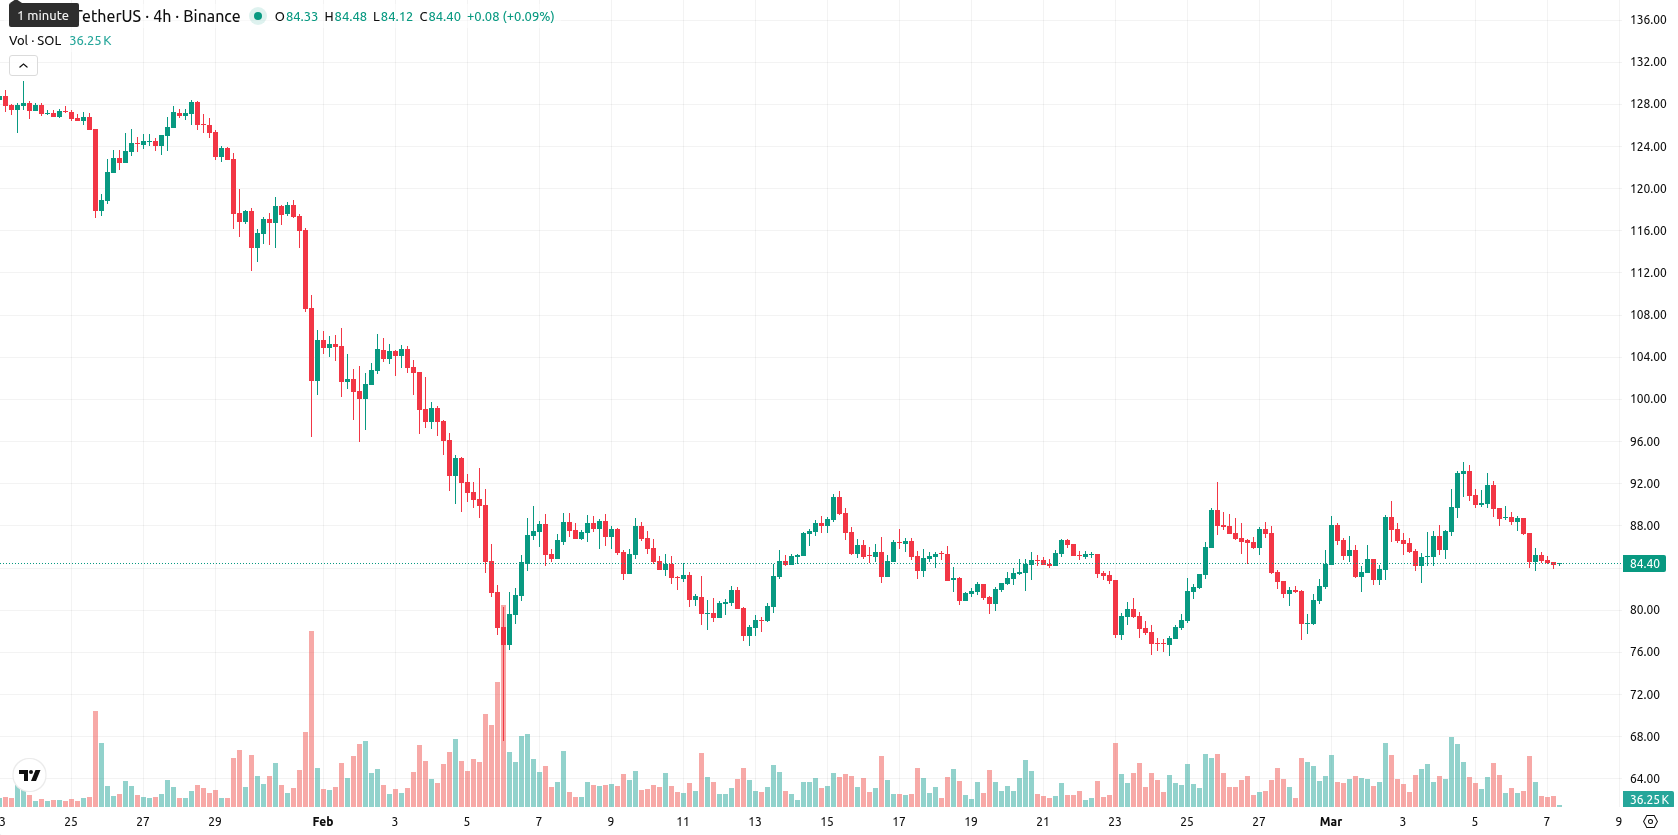
Solana (SOL) is trading at $84.38, slightly below both its MA-20 ($84.67) and well under the MA-50 ($99.28) and MA-200 ($154.36). This setup indicates short-term and medium-term bearish pressure, and a firmly negative long-term trend. The Ichimoku Kijun at $84.84 sits above the current price and acts as immediate resistance.
Highlights
- The SEC dropped its case against Justin Sun with a $10 million Rainberry settlement, signaling regulatory easing for U.S. crypto assets.
- Reduced legal risk and improved regulatory clarity have temporarily boosted institutional confidence, though Solana remains pressured by persistent market selling.
- Technical signals are decisively bearish, with SOL trading below major averages and a high probability of further declines within a $76–$92 range this week.
Regulatory settlement boosts sentiment as SEC softens crypto stance
On Thursday, the SEC dropped its lawsuit against Justin Sun with a $10 million settlement from Rainberry, reflecting a shift in regulatory posture towards greater accommodation of crypto assets in the United States. This action was viewed as potentially reducing immediate risks of broad crackdowns or legal barriers for assets like Solana by improving regulatory clarity and institutional confidence. These regulatory developments have shaped the current environment for Solana, though price action has remained under broader selling pressure.
Bearish momentum clashes with buyer attempts amid sustained selling
Momentum readings are distinctly bearish, with the MACD on D1 and W1 both generating strong sell signals, and the ADX registering a firm downtrend. The RSI on both daily and weekly timeframes points to ongoing weakness, showing neither oversold nor overbought extremes, while the Stochastic RSI and CCI remain neutral. Bull/Bear Power is classified as overbought on the daily interval but with a positive reading, hinting at recent buyer attempts, yet sellers maintain dominance across shorter timeframes. The Awesome Oscillator does not materially reinforce either direction. SOL opened with a small gap down and is currently trading near today’s low after slipping 4.53%. Volatility has been moderate and selling pressure has sustained since the open, aligning intraday weakness with broader negative momentum signals; some divergence is evident, as the overbought Bull/Bear Power clashes with broader bearish momentum.
Downside risks persist as support break looms without momentum shift
Over the coming week, SOL is expected to trade within a typical volatility band between $76.00 and $92.00 relative to current levels. The probability of a price increase in the next five days remains very low (under 20%), while potential for a further decline is higher given the absence of buy signals among major weekly indicators. The likely scenario sees SOL consolidating in a sideways corridor. A bullish reversal would require a clear breakout above immediate resistance at $84.84, which remains unlikely without a shift in momentum, while a break below support near $80 would confirm further downside.
Previously it was reported that Solana is trading just below its 20-day moving average and remains well beneath its 50- and 200-day trend lines, with both price action and multiple momentum indicators (RSI, MACD, ADX) signaling persistent downside pressure amid declining on-chain activity and significant ETF outflows. Immediate resistance is seen near $84.84 with short-term support at $80.00; continued selling could drive the asset toward $76.00, while the probability of an upside move remains low, consolidating the bearish bias for the coming week.


Latest Solana News


-
 Afghanistan
-
 Albania
-
 Algeria
-
 Angola
-
 Argentina
-
 Armenia
-
 Australia
-
 Austria
-
 Azerbaijan
-
 Bahamas
-
 Bahrain
-
 Bangladesh
-
 Belarus
-
 Belgium
-
 Bolivia
-
 Botswana
-
 Brazil
-
 Brunei
-
 Bulgaria
-
 Cambodia
-
 Cameroon
-
 Canada
-
 Chile
Chile
-
 China
China
-
 Colombia
-
 Congo
Congo
-
 Costa Rica
-
 Cote d'Ivoire
-
 Croatia
-
 Cuba
Cuba
-
 Cyprus
-
 Czechia
-
 DR Congo
-
 Denmark
-
 Dominican Republic
-
 Ecuador
-
 Egypt
Egypt
-
 El Salvador
-
 Estonia
-
 Eswatini
-
 Ethiopia
-
 Finland
-
 France
-
 Georgia
-
 Germany
-
 Ghana
Ghana
-
 Greece
-
 Haiti
Haiti
-
 Hong Kong
-
 Hungary
-
 India
India
-
 Indonesia
-
 Iran, Islamic republic
-
 Iraq
Iraq
-
 Ireland
-
 Israel
-
 Italy
Italy
-
 Jamaica
-
 Japan
Japan
-
 Jordan
-
 Kazakhstan
-
 Kenya
Kenya
-
 Korea
Korea
-
 Kuwait
-
 Kyrgyzstan
-
 Laos
Laos
-
 Latvia
-
 Lebanon
-
 Lesotho
-
 Libya
Libya
-
 Lithuania
-
 Luxembourg
-
 Madagascar
-
 Malaysia
-
 Malta
Malta
-
 Mauritius
-
 Mexico
-
 Moldova
-
 Mongolia
-
 Montenegro
-
 Morocco
-
 Mozambique
-
 Myanmar
-
 Namibia
-
 Nepal
Nepal
-
 Netherlands
-
 New Zealand
-
 Nigeria
-
 North Macedonia
-
 Norway
-
 Oman
Oman
-
 Pakistan
-
 Palestine
-
 Panama
-
 Papua New Guinea
-
 Paraguay
-
 Peru
Peru
-
 Philippines
-
 Poland
-
 Portugal
-
 Puerto Rico
-
 Qatar
Qatar
-
 Reunion
-
 Romania
-
 Rwanda
-
 Saudi Arabia
-
 Serbia
-
 Singapore
-
 Slovakia
-
 Slovenia
-
 Somalia
-
 South Africa
-
 Spain
Spain
-
 Sri Lanka
-
 Sweden
-
 Switzerland
-
 Syria
Syria
-
 Taiwan
-
 Tajikistan
-
 Tanzania
-
 Thailand
-
 Trinidad and Tobago
-
 Tunisia
-
 Turkey
-
 UAE
UAE
-
 Uganda
-
 Ukraine
-
 United Kingdom
-
United States
-
 Uruguay
-
 Uzbekistan
-
 Venezuela
-
 Vietnam
-
 Yemen
Yemen
-
 Zambia
-
 Zimbabwe
- Forex
- Crypto
