
Solana price prediction: Bearish technicals and weak flows suggest lower risk for SOL

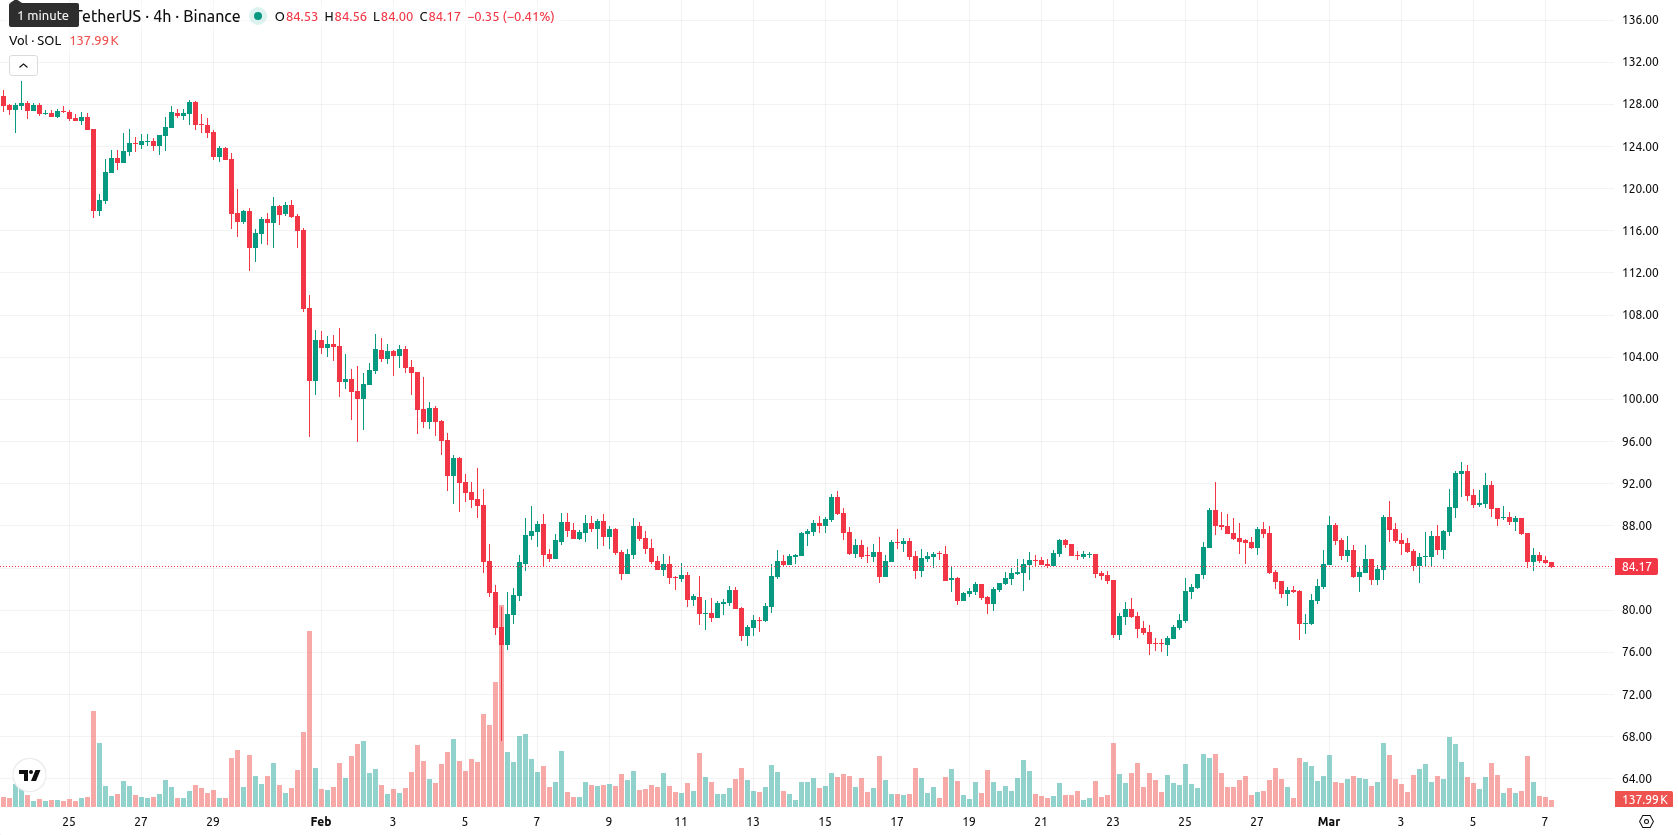
Solana (SOL) is trading at $84.23, very slightly below the 20-day Simple Moving Average ($84.67) and well beneath both the 50-day ($99.28) and 200-day ($154.36) SMAs, indicating ongoing pressure from sellers in the short, medium, and long term. The Ichimoku Kijun at $84.84 stands as immediate resistance above the current price.
Highlights
- Solana ETFs saw $6 million in net outflows after recent inflows, with cumulative ETF investments nearing $1.5 billion, half from institutional players.
- Despite $650 billion in February stablecoin volume and growing validator participation, Solana's daily network revenue hit a 30-day low amid fading on-chain activity.
- SOL trades below major moving averages, with indicators signaling strong downside risk and a likely range of $76.00 to $92.00 next week.
ETF outflows and fading on-chain activity intensify institutional caution
On March 5, Solana ETFs saw $6 million in net outflows across six products after net inflows the previous day, with cumulative ETF inflows now totaling nearly $1.5 billion and about half attributed to institutional investors who file 13F disclosures. February recorded $650 billion in on-chain stablecoin volume on the Solana network. Daily network revenue dropped to a 30-day low of $314,700 on March 4 as on-chain activity decreased, and a significant rise in payment transaction volume as well as an expanding validator network were reported, though price action has remained under broader selling pressure.
Downside momentum builds as intraday selloff aligns with key signals
Momentum indicators show a firm downside bias, with the MACD and ADX both highlighting persistent selling pressure. The RSI on the daily chart is 45.03, not in oversold territory but confirming a bearish tilt, while the Stochastic RSI and Commodity Channel Index are mostly neutral, though some oversold signals appear on shorter timeframes. Bull/Bear Power is firmly in overbought territory, indicating that sellers have the upper hand in intraday momentum. The daily drop of 4.49% left SOL near the session low of $84.03, reflecting high volatility and a clear alignment between negative momentum and the intraday selloff, without major divergence among oscillators and momentum signals.
Bearish bias prevails for week as technicals point to renewed lows
For the coming week, SOL is projected to remain within a typical volatility band relative to current levels, ranging from $76.00 to $92.00. The probability of an increase is very low (less than 20%), with a decline more likely based on unified bearish signals from the weekly RSI, ADX, MACD, and Moving Averages. In the base case, SOL could consolidate sideways between $80.00 and $88.00. A bullish scenario would require a daily close above immediate resistance, targeting $90.00 to $92.00, while sustained selling below support levels could open up a move toward $76.00.
Previously it was reported that Solana is trading above its 20-day moving average, signaling near-term support, but remains below the 50- and 200-day moving averages, reflecting continued medium- and long-term bearish momentum. Momentum indicators including MACD and RSI point to further downside, with immediate support near $84.84 and resistance at $93.00, while elevated volatility suggests a strong likelihood of continued weakness or sideways movement in the short term.


Latest Solana News


-
 Afghanistan
-
 Albania
-
 Algeria
-
 Angola
-
 Argentina
-
 Armenia
-
 Australia
-
 Austria
-
 Azerbaijan
-
 Bahamas
-
 Bahrain
-
 Bangladesh
-
 Belarus
-
 Belgium
-
 Bolivia
-
 Botswana
-
 Brazil
-
 Brunei
-
 Bulgaria
-
 Cambodia
-
 Cameroon
-
 Canada
-
 Chile
Chile
-
 China
China
-
 Colombia
-
 Congo
Congo
-
 Costa Rica
-
 Cote d'Ivoire
-
 Croatia
-
 Cuba
Cuba
-
 Cyprus
-
 Czechia
-
 DR Congo
-
 Denmark
-
 Dominican Republic
-
 Ecuador
-
 Egypt
Egypt
-
 El Salvador
-
 Estonia
-
 Eswatini
-
 Ethiopia
-
 Finland
-
 France
-
 Georgia
-
 Germany
-
 Ghana
Ghana
-
 Greece
-
 Haiti
Haiti
-
 Hong Kong
-
 Hungary
-
 India
India
-
 Indonesia
-
 Iran, Islamic republic
-
 Iraq
Iraq
-
 Ireland
-
 Israel
-
 Italy
Italy
-
 Jamaica
-
 Japan
Japan
-
 Jordan
-
 Kazakhstan
-
 Kenya
Kenya
-
 Korea
Korea
-
 Kuwait
-
 Kyrgyzstan
-
 Laos
Laos
-
 Latvia
-
 Lebanon
-
 Lesotho
-
 Libya
Libya
-
 Lithuania
-
 Luxembourg
-
 Madagascar
-
 Malaysia
-
 Malta
Malta
-
 Mauritius
-
 Mexico
-
 Moldova
-
 Mongolia
-
 Montenegro
-
 Morocco
-
 Mozambique
-
 Myanmar
-
 Namibia
-
 Nepal
Nepal
-
 Netherlands
-
 New Zealand
-
 Nigeria
-
 North Macedonia
-
 Norway
-
 Oman
Oman
-
 Pakistan
-
 Palestine
-
 Panama
-
 Papua New Guinea
-
 Paraguay
-
 Peru
Peru
-
 Philippines
-
 Poland
-
 Portugal
-
 Puerto Rico
-
 Qatar
Qatar
-
 Reunion
-
 Romania
-
 Rwanda
-
 Saudi Arabia
-
 Serbia
-
 Singapore
-
 Slovakia
-
 Slovenia
-
 Somalia
-
 South Africa
-
 Spain
Spain
-
 Sri Lanka
-
 Sweden
-
 Switzerland
-
 Syria
Syria
-
 Taiwan
-
 Tajikistan
-
 Tanzania
-
 Thailand
-
 Trinidad and Tobago
-
 Tunisia
-
 Turkey
-
 UAE
UAE
-
 Uganda
-
 Ukraine
-
 United Kingdom
-
United States
-
 Uruguay
-
 Uzbekistan
-
 Venezuela
-
 Vietnam
-
 Yemen
Yemen
-
 Zambia
-
 Zimbabwe
- Forex
- Crypto
