
Class-action lawsuit targets Solana Labs — Solana gains 1.94%

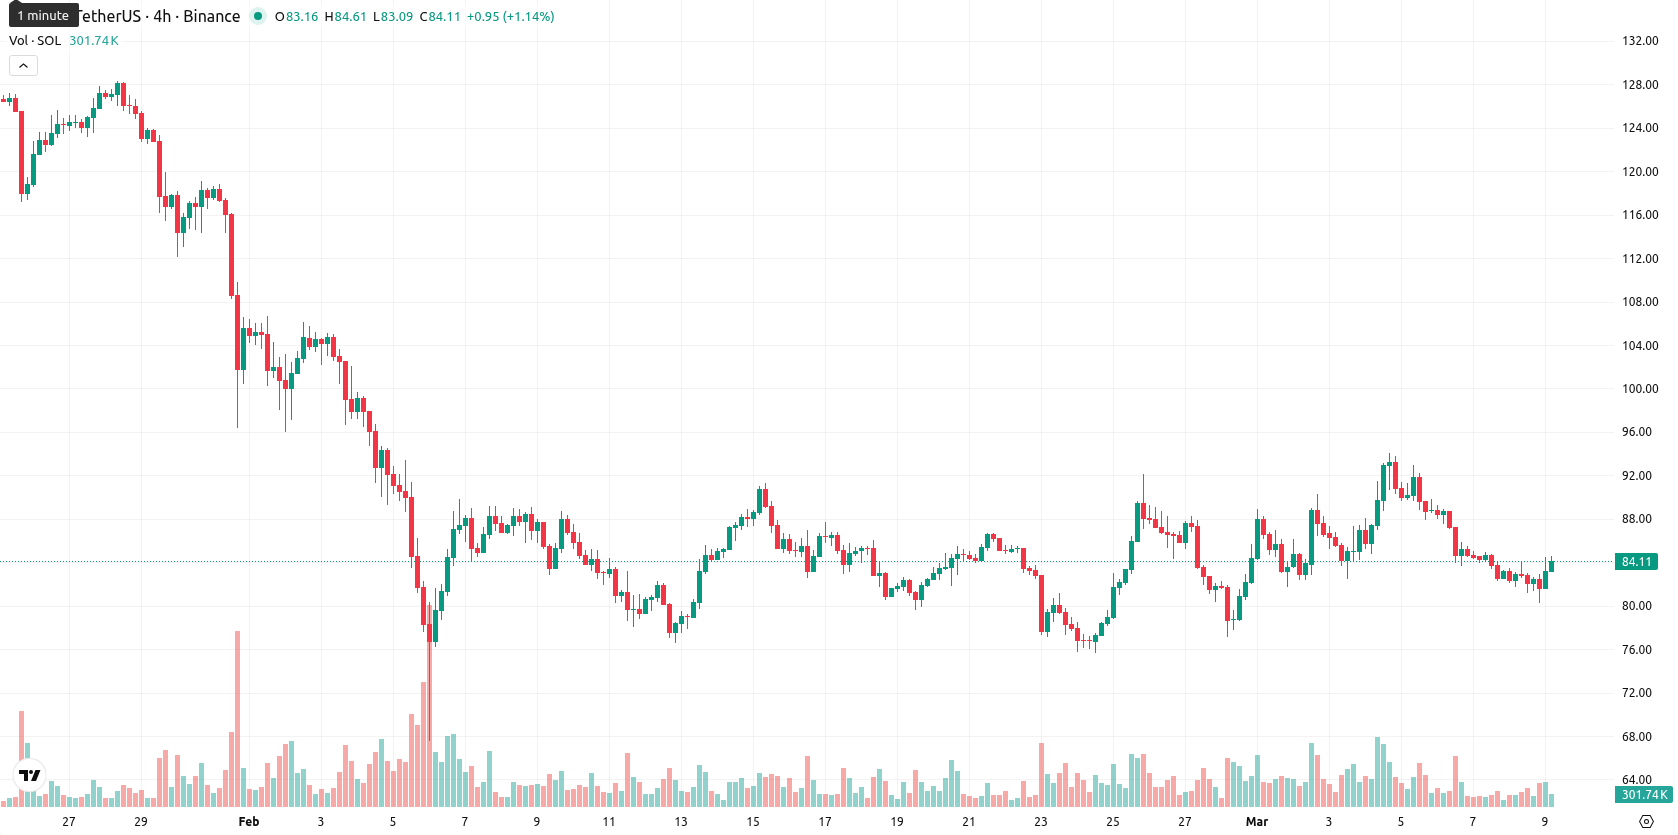
Solana (SOL) trades at $83.99, slightly below the MA-20 ($84.29), well under the MA-50 ($96.81), and far below the MA-200 ($153.36). This configuration indicates ongoing short- and medium-term bearish pressure, while long-term sentiment remains negative; the Ichimoku Kijun level at $84.84 now acts as immediate resistance.
Highlights
- A class-action lawsuit targeting key Solana ecosystem entities introduces significant legal risk and regulatory overhang for the asset.
- The upcoming Clarity Act vote in March 2026 may redefine the legislative framework governing Solana and similar crypto assets.
- SOL currently trades in a bearish trend below major technical levels, with a projected weekly range between $77 and $92 and momentum indicators signaling continued weakness.
Legal overhang intensifies as lawsuit and regulatory shifts hit Solana
A class-action lawsuit has been filed against key entities within the Solana ecosystem, including Solana Labs and operators of major platforms, creating significant legal overhang and regulatory uncertainty. The scheduled Clarity Act vote in March 2026 could reshape the wider legislative context for Solana and similar crypto assets, with potential repercussions for legal risks and operational protocols. These developments continue to impact investor sentiment and liquidity, as participants adjust positions in response to ongoing legal challenges.
Momentum mixed as oscillators diverge on daily bearish trend
Momentum indicators on the daily chart highlight persistent weakness: MACD points to a strong sell, and ADX indicates strong trend momentum, both suggesting continued bearish sentiment. Oscillator readings show mild oversold conditions, with RSI and CCI reflecting 'sell' signals and values below neutral, while the Stochastic RSI is at neutral; Bull/Bear Power is in the oversold zone, confirming intraday seller dominance. Despite a $1.6 (1.94%) daily gain and trading near session highs, the Awesome Oscillator is turning slightly positive, diverging from bearish signals elsewhere—a sign of mixed short-term direction.
Further declines likely as resistance caps upside amid low bullish odds
For the coming week, the typical volatility band for SOL is projected between $77 and $92 based on current momentum. The probability of a price increase is low (less than 20%), so further declines remain likely, with baseline expectations for sideways price action in the $77 to $92 range. A bullish outcome requires a clear move above the $84.84 resistance, while a bearish scenario may develop if sellers push the price below $77. Overall, prevailing bias favors continued weakness unless buyers regain control above immediate resistance.
Previously it was reported that Solana is trading under sustained selling pressure, remaining below all major moving averages and encountering immediate resistance at the Ichimoku Kijun line, with momentum indicators including MACD, ADX, and RSI signaling continued bearish conditions and limited upside potential. Institutional inflows are rising despite regulatory uncertainties, but technicals indicate a likely range-bound movement between support near $75 and resistance at $91 unless a decisive breakout occurs.


Latest Solana News


-
 Afghanistan
-
 Albania
-
 Algeria
-
 Angola
-
 Argentina
-
 Armenia
-
 Australia
-
 Austria
-
 Azerbaijan
-
 Bahamas
-
 Bahrain
-
 Bangladesh
-
 Belarus
-
 Belgium
-
 Bolivia
-
 Botswana
-
 Brazil
-
 Brunei
-
 Bulgaria
-
 Cambodia
-
 Cameroon
-
 Canada
-
 Chile
Chile
-
 China
China
-
 Colombia
-
 Congo
Congo
-
 Costa Rica
-
 Cote d'Ivoire
-
 Croatia
-
 Cuba
Cuba
-
 Cyprus
-
 Czechia
-
 DR Congo
-
 Denmark
-
 Dominican Republic
-
 Ecuador
-
 Egypt
Egypt
-
 El Salvador
-
 Estonia
-
 Eswatini
-
 Ethiopia
-
 Finland
-
 France
-
 Georgia
-
 Germany
-
 Ghana
Ghana
-
 Greece
-
 Haiti
Haiti
-
 Hong Kong
-
 Hungary
-
 India
India
-
 Indonesia
-
 Iran, Islamic republic
-
 Iraq
Iraq
-
 Ireland
-
 Israel
-
 Italy
Italy
-
 Jamaica
-
 Japan
Japan
-
 Jordan
-
 Kazakhstan
-
 Kenya
Kenya
-
 Korea
Korea
-
 Kuwait
-
 Kyrgyzstan
-
 Laos
Laos
-
 Latvia
-
 Lebanon
-
 Lesotho
-
 Libya
Libya
-
 Lithuania
-
 Luxembourg
-
 Madagascar
-
 Malaysia
-
 Malta
Malta
-
 Mauritius
-
 Mexico
-
 Moldova
-
 Mongolia
-
 Montenegro
-
 Morocco
-
 Mozambique
-
 Myanmar
-
 Namibia
-
 Nepal
Nepal
-
 Netherlands
-
 New Zealand
-
 Nigeria
-
 North Macedonia
-
 Norway
-
 Oman
Oman
-
 Pakistan
-
 Palestine
-
 Panama
-
 Papua New Guinea
-
 Paraguay
-
 Peru
Peru
-
 Philippines
-
 Poland
-
 Portugal
-
 Puerto Rico
-
 Qatar
Qatar
-
 Reunion
-
 Romania
-
 Rwanda
-
 Saudi Arabia
-
 Serbia
-
 Singapore
-
 Slovakia
-
 Slovenia
-
 Somalia
-
 South Africa
-
 Spain
Spain
-
 Sri Lanka
-
 Sweden
-
 Switzerland
-
 Syria
Syria
-
 Taiwan
-
 Tajikistan
-
 Tanzania
-
 Thailand
-
 Trinidad and Tobago
-
 Tunisia
-
 Turkey
-
 UAE
UAE
-
 Uganda
-
 Ukraine
-
 United Kingdom
-
United States
-
 Uruguay
-
 Uzbekistan
-
 Venezuela
-
 Vietnam
-
 Yemen
Yemen
-
 Zambia
-
 Zimbabwe
- Forex
- Crypto
