
SEC scrutiny limits ETF access — Solana drops 1.6%

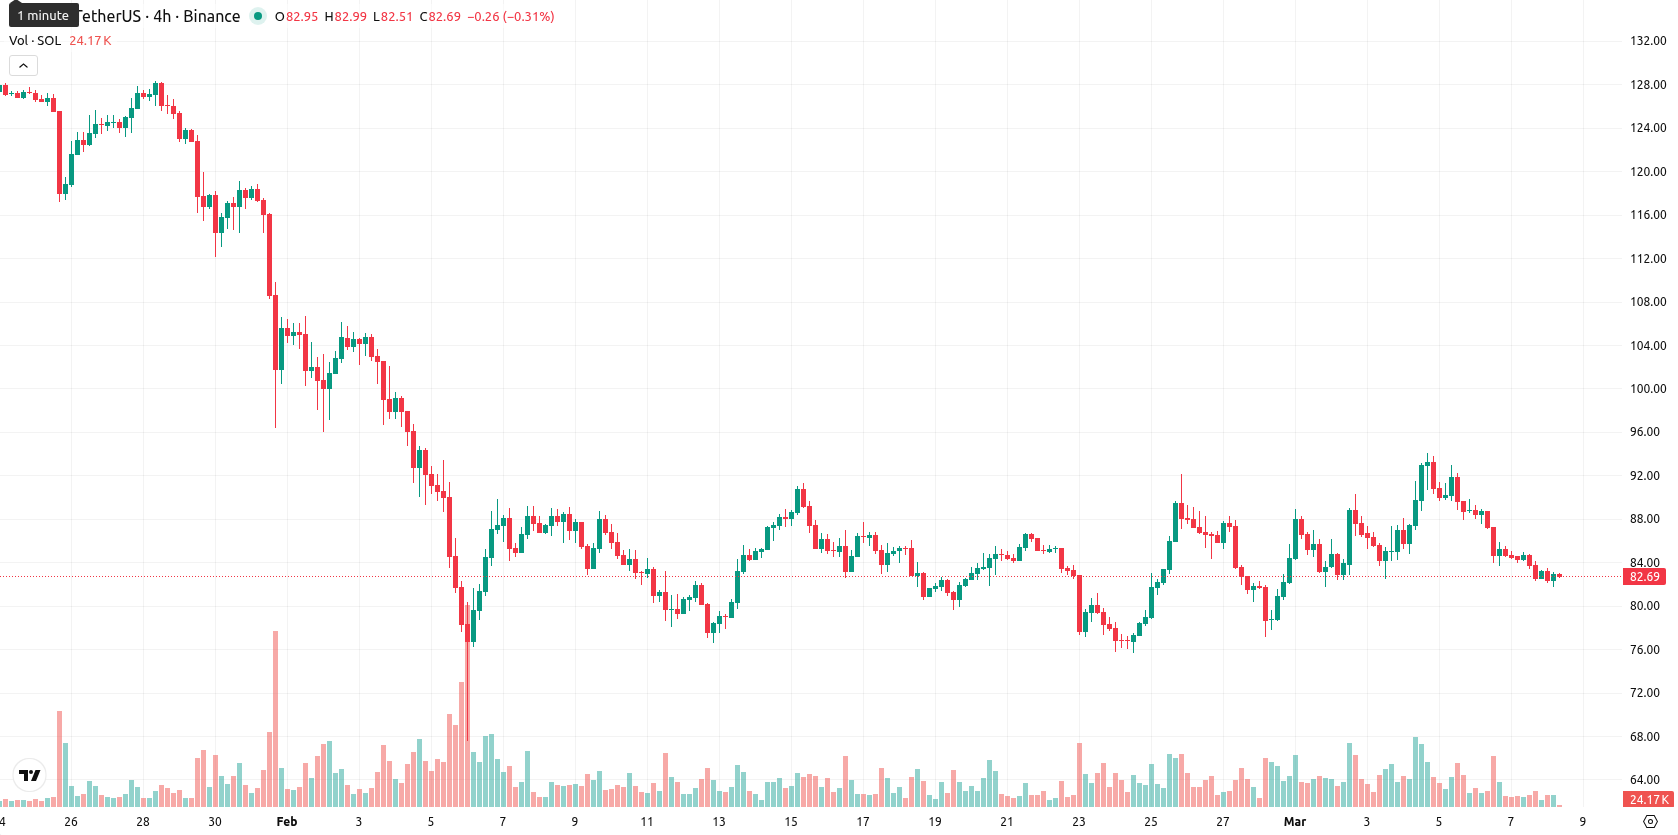
Solana (SOL) is trading at $82.80, down 1.60% on the day, and remains below the MA-20 at $84.50, the MA-50 at $98.04, and the MA-200 at $153.89, indicating continued seller pressure across all observed timeframes. The Ichimoku Kijun sits at $84.84, acting as immediate resistance above the current level.
Highlights
- Franklin Solana ETF (SOEZ) saw a significant institutional inflow despite persistent regulatory uncertainty surrounding Solana’s classification in the US.
- The upcoming US Clarity Act vote in March 2026 could further impact Solana’s legal status and future investor access.
- Solana remains under strong bearish technical pressure, likely consolidating between $75.00 and $91.00 over the next five trading days.
Institutional inflows rise despite persistent regulatory uncertainty
On March 4, 2026, the Franklin Solana ETF (SOEZ) recorded a sharp inflow, reflecting increased institutional interest in Solana exposure amid ongoing regulatory scrutiny. The SEC has previously identified SOL as a potential unregistered security, which continues to restrict broader participation and ETF eligibility for the asset. The upcoming vote on the US Clarity Act in March 2026 presents further legal uncertainty regarding Solana’s classification and future accessibility, while macroeconomic factors such as the US dollar’s strength and Federal Reserve policy are also influencing asset flows. Heightened regulatory uncertainty and the risk of adverse classification by US authorities remain key risks, though price action has remained under broader selling pressure.
Bearish momentum dominates as oscillators and averages align
Technical signals show Solana remaining under pronounced bearish conditions, with price trading below all major moving averages. The Ichimoku Kijun at $84.84 marks immediate resistance, with momentum indicators on the daily timeframe — including MACD and ADX — both highlighting strong selling pressure. RSI, CCI, and Stochastic RSI rest in neutral to mild sell zones, while Bull/Bear Power is oversold, confirming dominance by sellers. The Awesome Oscillator offers a rare daily buy signal, though it diverges from the prevailing bearish outlook across most indicators.
Limited upside as strong resistance constrains rebound prospects
Near term, Solana is expected to trade within a volatility band of $75.00 to $91.00, based on prevailing momentum and volatility conditions. The probability of a sustained price increase is less than 20%, with technical signals continuing to favor further declines. A bullish move would require a decisive break above resistance near $84.80, putting the $91.00 level in focus, while a drop below $75.00 could trigger an extended retracement if sellers maintain control.
Previously it was reported that Solana continues to trade with persistent bearish momentum, remaining below its 20-day, 50-day, and 200-day moving averages, with technical indicators such as MACD and ADX confirming ongoing downside risk and RSI signaling a lack of oversold conditions. Immediate resistance stands at $84.84, while price action is expected to remain volatile and range-bound, with limited upside probability unless momentum indicators shift decisively bullish.


Latest Solana News


-
 Afghanistan
-
 Albania
-
 Algeria
-
 Angola
-
 Argentina
-
 Armenia
-
 Australia
-
 Austria
-
 Azerbaijan
-
 Bahamas
-
 Bahrain
-
 Bangladesh
-
 Belarus
-
 Belgium
-
 Bolivia
-
 Botswana
-
 Brazil
-
 Brunei
-
 Bulgaria
-
 Cambodia
-
 Cameroon
-
 Canada
-
 Chile
Chile
-
 China
China
-
 Colombia
-
 Congo
Congo
-
 Costa Rica
-
 Cote d'Ivoire
-
 Croatia
-
 Cuba
Cuba
-
 Cyprus
-
 Czechia
-
 DR Congo
-
 Denmark
-
 Dominican Republic
-
 Ecuador
-
 Egypt
Egypt
-
 El Salvador
-
 Estonia
-
 Eswatini
-
 Ethiopia
-
 Finland
-
 France
-
 Georgia
-
 Germany
-
 Ghana
Ghana
-
 Greece
-
 Haiti
Haiti
-
 Hong Kong
-
 Hungary
-
 India
India
-
 Indonesia
-
 Iran, Islamic republic
-
 Iraq
Iraq
-
 Ireland
-
 Israel
-
 Italy
Italy
-
 Jamaica
-
 Japan
Japan
-
 Jordan
-
 Kazakhstan
-
 Kenya
Kenya
-
 Korea
Korea
-
 Kuwait
-
 Kyrgyzstan
-
 Laos
Laos
-
 Latvia
-
 Lebanon
-
 Lesotho
-
 Libya
Libya
-
 Lithuania
-
 Luxembourg
-
 Madagascar
-
 Malaysia
-
 Malta
Malta
-
 Mauritius
-
 Mexico
-
 Moldova
-
 Mongolia
-
 Montenegro
-
 Morocco
-
 Mozambique
-
 Myanmar
-
 Namibia
-
 Nepal
Nepal
-
 Netherlands
-
 New Zealand
-
 Nigeria
-
 North Macedonia
-
 Norway
-
 Oman
Oman
-
 Pakistan
-
 Palestine
-
 Panama
-
 Papua New Guinea
-
 Paraguay
-
 Peru
Peru
-
 Philippines
-
 Poland
-
 Portugal
-
 Puerto Rico
-
 Qatar
Qatar
-
 Reunion
-
 Romania
-
 Rwanda
-
 Saudi Arabia
-
 Serbia
-
 Singapore
-
 Slovakia
-
 Slovenia
-
 Somalia
-
 South Africa
-
 Spain
Spain
-
 Sri Lanka
-
 Sweden
-
 Switzerland
-
 Syria
Syria
-
 Taiwan
-
 Tajikistan
-
 Tanzania
-
 Thailand
-
 Trinidad and Tobago
-
 Tunisia
-
 Turkey
-
 UAE
UAE
-
 Uganda
-
 Ukraine
-
 United Kingdom
-
United States
-
 Uruguay
-
 Uzbekistan
-
 Venezuela
-
 Vietnam
-
 Yemen
Yemen
-
 Zambia
-
 Zimbabwe
- Forex
- Crypto
