
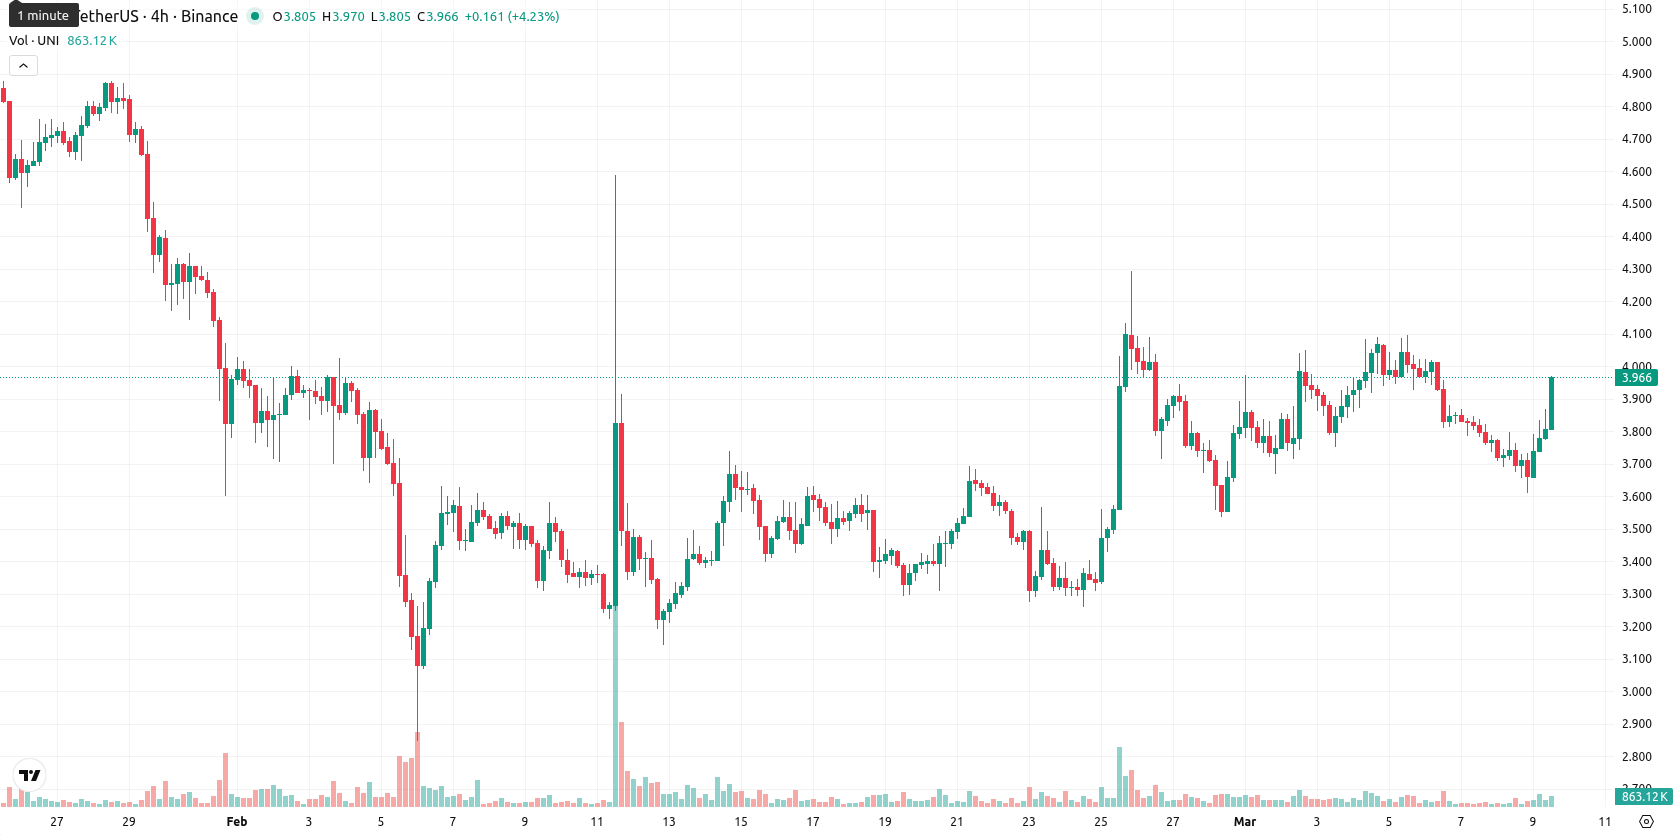
+7.35% for Uniswap — Intraday momentum sparks rally despite mixed trend indicators

Uniswap (UNI) is trading at $3.956, up 7.35% on the day, positioned above the MA-20 ($3.6960) and just above the MA-50 ($3.9333), yet remains well below the MA-200 ($6.2889). This reflects short-term bullish momentum for UNI, but continued medium- and long-term selling pressure persists as the price pushes toward the session’s highs.
Highlights
- UNI currently trades with short-term bullish momentum and positive intraday bias, but faces persistent medium- and long-term bearish pressure.
- Neutral momentum indicators and high volatility suggest recent strength may be unsustainable, with several short-term signals overbought.
- Expected five-day trading range is $3.80–$4.20, with sideways movement likely unless resistance at $4.20 is surpassed or support at $3.87 breaks.
Intraday buyer dominance amid mixed technical signals
Short-term indicators are mixed for UNI. The Ichimoku Kijun (D1) stands at $3.8650, providing immediate support below current levels. The daily MACD and ADX readings are neutral, indicating weak trend conviction, while the RSI leans mildly bearish but is not oversold. The Stochastic RSI and CCI are also neutral on the daily timeframe, though intraday indicators show overbought signals on shorter timeframes. Bull/Bear Power remains positive, signaling buyer dominance for the session. Volatility is elevated, and price action remains near session highs, showcasing strong intraday momentum despite a divergence from neutral underlying trends.
Sideways consolidation expected as upside momentum fades
Over the next five trading days, UNI’s typical volatility band is seen between $3.80 and $4.20, with current levels near the middle of this range. Given mixed momentum signals and recent fast gains, the probability of further upward movement is low (less than 20%), and the base expectation is for sideways consolidation between $3.87 (support) and $4.20 (resistance). Upside would require a sustained breakout above $4.20, while a move below $3.87 could fuel a drop to $3.80 or below, aligning with overall medium- and long-term price pressure.
Previously it was reported that Uniswap continues to trade below its key moving averages, with technical indicators including MACD, RSI, and CCI reflecting sustained bearish momentum and mild oversold conditions. For the coming week, the asset faces resistance near $4.48 and support at $3.31, with low probability of a bullish reversal and a bias toward sideways or further downside movement.


Latest Uniswap (UNI) News


-
 Afghanistan
-
 Albania
-
 Algeria
-
 Angola
-
 Argentina
-
 Armenia
-
 Australia
-
 Austria
-
 Azerbaijan
-
 Bahamas
-
 Bahrain
-
 Bangladesh
-
 Belarus
-
 Belgium
-
 Bolivia
-
 Botswana
-
 Brazil
-
 Brunei
-
 Bulgaria
-
 Cambodia
-
 Cameroon
-
 Canada
-
 Chile
Chile
-
 China
China
-
 Colombia
-
 Congo
Congo
-
 Costa Rica
-
 Cote d'Ivoire
-
 Croatia
-
 Cuba
Cuba
-
 Cyprus
-
 Czechia
-
 DR Congo
-
 Denmark
-
 Dominican Republic
-
 Ecuador
-
 Egypt
Egypt
-
 El Salvador
-
 Estonia
-
 Eswatini
-
 Ethiopia
-
 Finland
-
 France
-
 Georgia
-
 Germany
-
 Ghana
Ghana
-
 Greece
-
 Haiti
Haiti
-
 Hong Kong
-
 Hungary
-
 India
India
-
 Indonesia
-
 Iran, Islamic republic
-
 Iraq
Iraq
-
 Ireland
-
 Israel
-
 Italy
Italy
-
 Jamaica
-
 Japan
Japan
-
 Jordan
-
 Kazakhstan
-
 Kenya
Kenya
-
 Korea
Korea
-
 Kuwait
-
 Kyrgyzstan
-
 Laos
Laos
-
 Latvia
-
 Lebanon
-
 Lesotho
-
 Libya
Libya
-
 Lithuania
-
 Luxembourg
-
 Madagascar
-
 Malaysia
-
 Malta
Malta
-
 Mauritius
-
 Mexico
-
 Moldova
-
 Mongolia
-
 Montenegro
-
 Morocco
-
 Mozambique
-
 Myanmar
-
 Namibia
-
 Nepal
Nepal
-
 Netherlands
-
 New Zealand
-
 Nigeria
-
 North Macedonia
-
 Norway
-
 Oman
Oman
-
 Pakistan
-
 Palestine
-
 Panama
-
 Papua New Guinea
-
 Paraguay
-
 Peru
Peru
-
 Philippines
-
 Poland
-
 Portugal
-
 Puerto Rico
-
 Qatar
Qatar
-
 Reunion
-
 Romania
-
 Rwanda
-
 Saudi Arabia
-
 Serbia
-
 Singapore
-
 Slovakia
-
 Slovenia
-
 Somalia
-
 South Africa
-
 Spain
Spain
-
 Sri Lanka
-
 Sweden
-
 Switzerland
-
 Syria
Syria
-
 Taiwan
-
 Tajikistan
-
 Tanzania
-
 Thailand
-
 Trinidad and Tobago
-
 Tunisia
-
 Turkey
-
 UAE
UAE
-
 Uganda
-
 Ukraine
-
 United Kingdom
-
United States
-
 Uruguay
-
 Uzbekistan
-
 Venezuela
-
 Vietnam
-
 Yemen
Yemen
-
 Zambia
-
 Zimbabwe
- Forex
- Crypto
