
LDO rises 4.36% facing resistance at MA-20 after testing lower 7-day range – weekly forecast

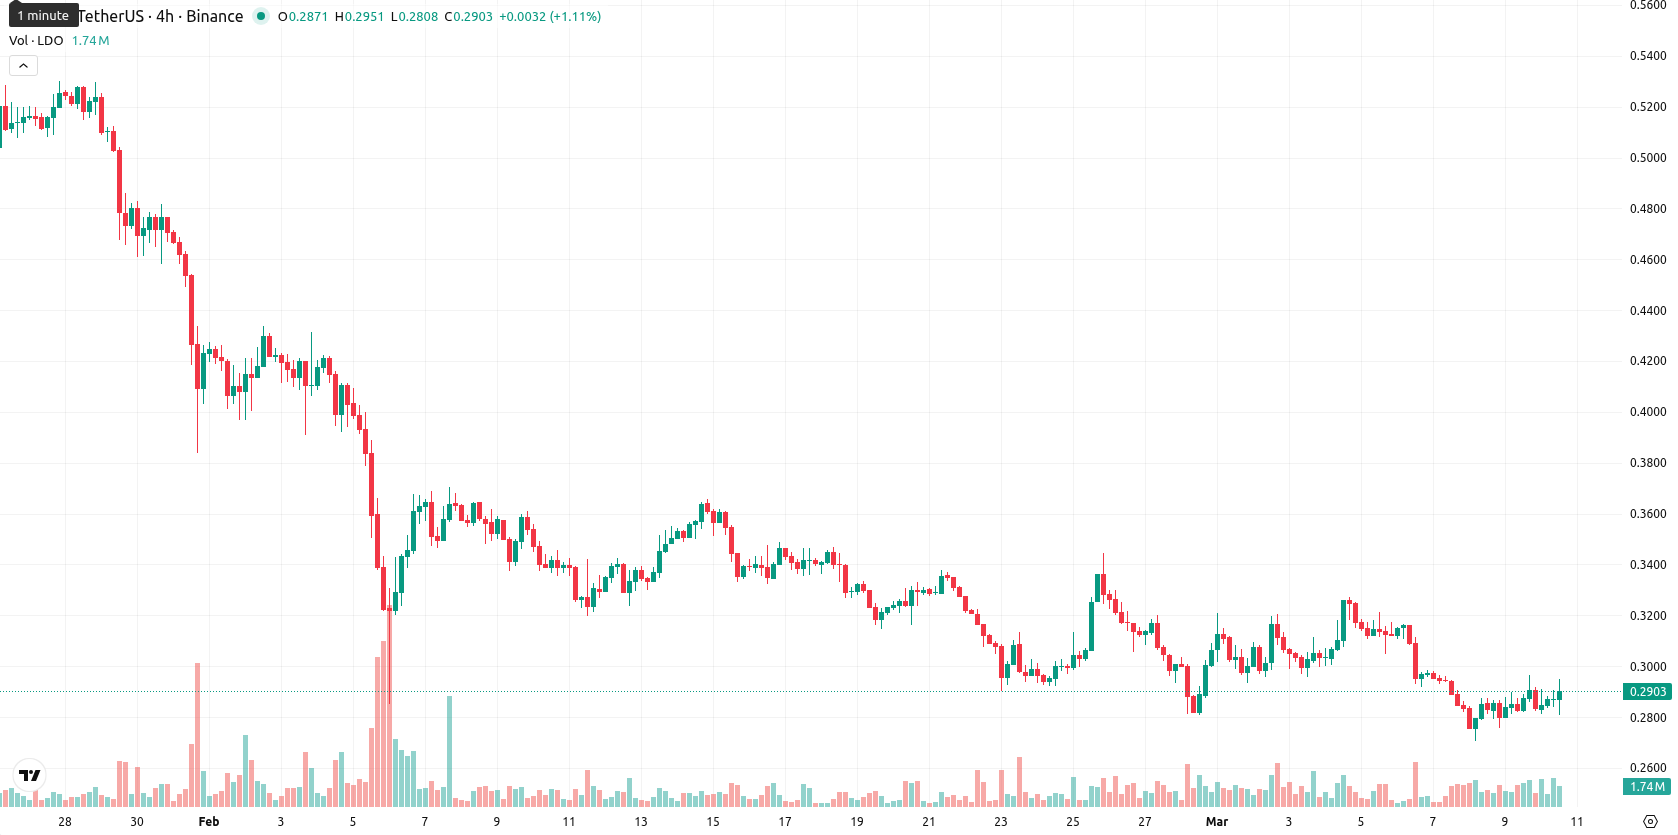
Lido (LDO) is currently trading at $0.2914, positioned well below its weekly Moving Average-20 at $0.5302 and Moving Average-50 at $0.8041. Over the past week, LDO gained 4.36% in value, yet remains under medium- and long-term selling pressure with price action near the lower boundary of its recent weekly range.
Highlights
- LDO trades well below key moving averages, reflecting sustained medium- and long-term downward pressure from sellers.
- Momentum indicators continue to signal a bearish trend, with oversold conditions failing to drive a confirmed recovery.
- Expected price range is $0.2340 to $0.3490 for the week, with a low likelihood of upside breakout and higher probability of further downside.
Bearish momentum persists as oversold signals intensify this week
Weekly technical analysis continues to show strong bearish momentum for LDO. Both MACD and ADX remain on Sell signals, indicating persistent negative strength, while major oscillators like the RSI and Commodity Channel Index flag oversold readings. Stochastic RSI is at an extremely low level, further confirming an oversold market, and negative Bull/Bear Power underscores sustained seller dominance. LDO trades well below both its MA-20 and MA-50 with the nearest dynamic resistance found at MA-20 ($0.5302), while weekly volatility stands elevated at 20.87%.
Bearish bias likely to dominate as consolidation range expected next week
Looking ahead to the next 5–7 trading days, technical indicators suggest that LDO is likely to consolidate sideways between $0.2340 and $0.3490, as none of the weekly signals provide a Buy or Strong Buy case. The bearish bias persists with less than a 20% probability of a meaningful upside move. A clear close above $0.3490 could open room for a bullish breakout, while a drop below $0.2340 would reinforce the downside scenario and expose further losses if selling pressure resumes.
Previously it was reported that Lido is trading well below its key moving averages, with entrenched bearish momentum as confirmed by MACD, ADX, and oversold RSI levels, while the current price remains under pressure near immediate resistance at the Ichimoku Kijun line. Short- and medium-term technical indicators continue to signal strong downside risk, supporting expectations for further consolidation or potential new lows amid high volatility and persistent selling.


Latest Lido News


-
 Afghanistan
-
 Albania
-
 Algeria
-
 Angola
-
 Argentina
-
 Armenia
-
 Australia
-
 Austria
-
 Azerbaijan
-
 Bahamas
-
 Bahrain
-
 Bangladesh
-
 Belarus
-
 Belgium
-
 Bolivia
-
 Botswana
-
 Brazil
-
 Brunei
-
 Bulgaria
-
 Cambodia
-
 Cameroon
-
 Canada
-
 Chile
Chile
-
 China
China
-
 Colombia
-
 Congo
Congo
-
 Costa Rica
-
 Cote d'Ivoire
-
 Croatia
-
 Cuba
Cuba
-
 Cyprus
-
 Czechia
-
 DR Congo
-
 Denmark
-
 Dominican Republic
-
 Ecuador
-
 Egypt
Egypt
-
 El Salvador
-
 Estonia
-
 Eswatini
-
 Ethiopia
-
 Finland
-
 France
-
 Georgia
-
 Germany
-
 Ghana
Ghana
-
 Greece
-
 Haiti
Haiti
-
 Hong Kong
-
 Hungary
-
 India
India
-
 Indonesia
-
 Iran, Islamic republic
-
 Iraq
Iraq
-
 Ireland
-
 Israel
-
 Italy
Italy
-
 Jamaica
-
 Japan
Japan
-
 Jordan
-
 Kazakhstan
-
 Kenya
Kenya
-
 Korea
Korea
-
 Kuwait
-
 Kyrgyzstan
-
 Laos
Laos
-
 Latvia
-
 Lebanon
-
 Lesotho
-
 Libya
Libya
-
 Lithuania
-
 Luxembourg
-
 Madagascar
-
 Malaysia
-
 Malta
Malta
-
 Mauritius
-
 Mexico
-
 Moldova
-
 Mongolia
-
 Montenegro
-
 Morocco
-
 Mozambique
-
 Myanmar
-
 Namibia
-
 Nepal
Nepal
-
 Netherlands
-
 New Zealand
-
 Nigeria
-
 North Macedonia
-
 Norway
-
 Oman
Oman
-
 Pakistan
-
 Palestine
-
 Panama
-
 Papua New Guinea
-
 Paraguay
-
 Peru
Peru
-
 Philippines
-
 Poland
-
 Portugal
-
 Puerto Rico
-
 Qatar
Qatar
-
 Reunion
-
 Romania
-
 Rwanda
-
 Saudi Arabia
-
 Serbia
-
 Singapore
-
 Slovakia
-
 Slovenia
-
 Somalia
-
 South Africa
-
 Spain
Spain
-
 Sri Lanka
-
 Sweden
-
 Switzerland
-
 Syria
Syria
-
 Taiwan
-
 Tajikistan
-
 Tanzania
-
 Thailand
-
 Trinidad and Tobago
-
 Tunisia
-
 Turkey
-
 UAE
UAE
-
 Uganda
-
 Ukraine
-
 United Kingdom
-
United States
-
 Uruguay
-
 Uzbekistan
-
 Venezuela
-
 Vietnam
-
 Yemen
Yemen
-
 Zambia
-
 Zimbabwe
- Forex
- Crypto
