
+7.78% for Fetch.ai — Short-term rally struggles below key resistance

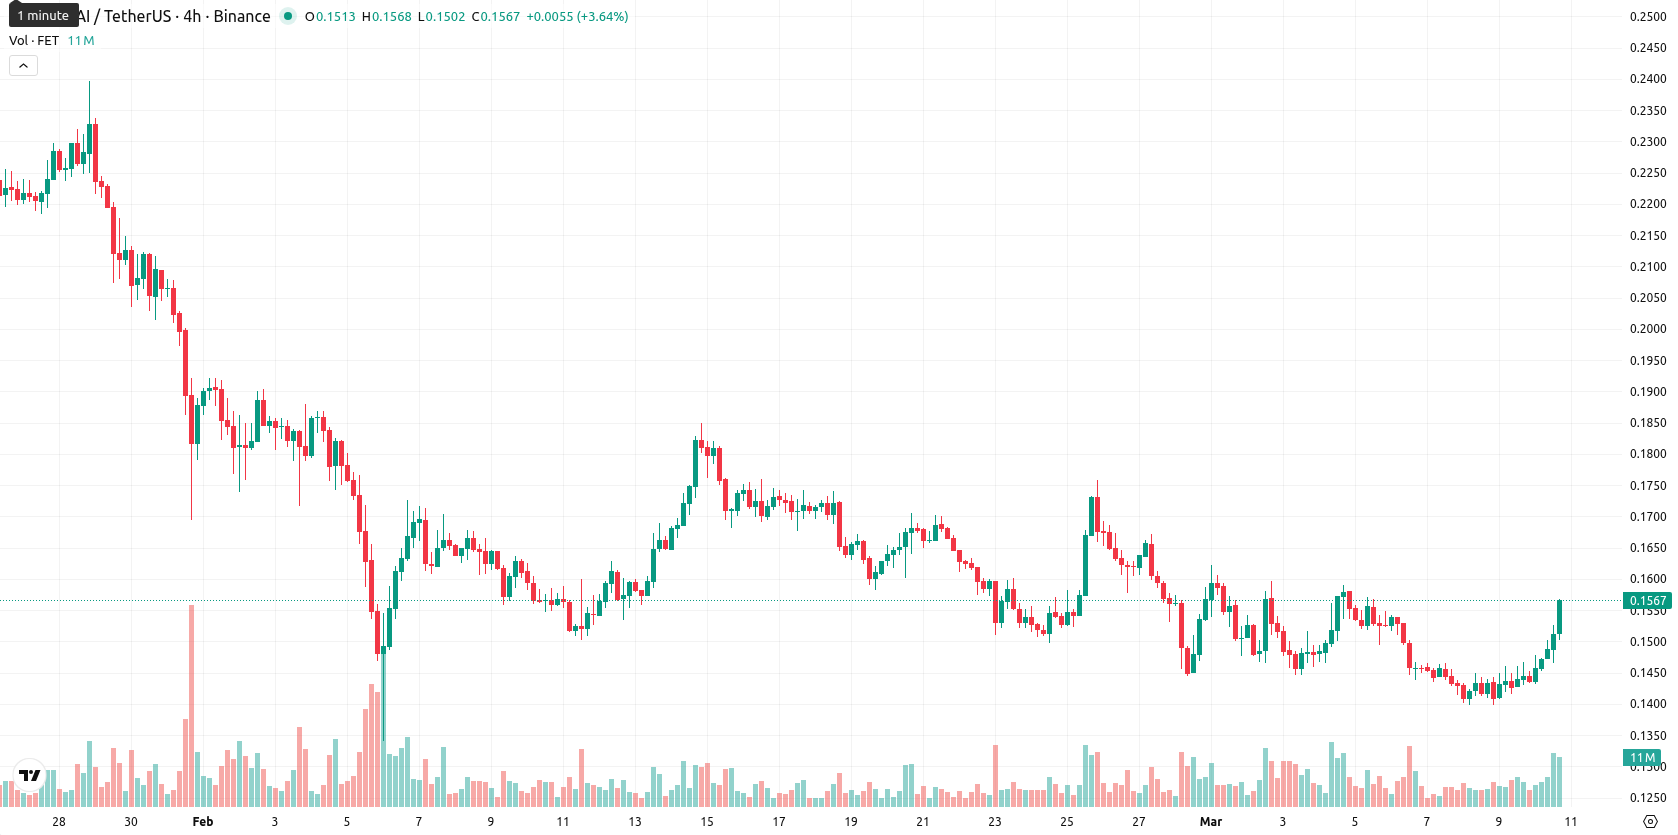
Fetch.ai (FET) is trading just above its SMA-20 at $0.1552, slightly exceeding the short-term trend marker, with a daily gain of 7.78%. Despite this move, the asset remains well below both its SMA-50 ($0.1778) and SMA-200 ($0.3288), highlighting continued medium- and long-term bearish pressure.
Highlights
- FET remains under bearish pressure, trading below key medium- and long-term trend markers, with sellers maintaining control.
- Momentum indicators are mixed, with classic oscillators showing weak momentum and oversold conditions while stochastic signals a possible short-term rebound.
- The price is expected to consolidate between $0.1500 and $0.1650, with a downside breakdown more probable unless $0.1624 resistance is breached.
Resistance at Kijun level as mixed momentum signals endure
FET is encountering resistance at the Ichimoku Kijun level of $0.1624, while technical signals remain mixed. The D1 MACD continues to indicate strong bearishness, and the ADX points to a downtrend of moderate strength; RSI at 37 and CCI readings confirm weak, oversold momentum. Despite a strong intraday move and price closing near session highs, Stoch RSI is in strong buy territory, demonstrating divergence from classic oscillators, while BBP remains negative and seller dominance persists. The market's volatility remains elevated, but overall, momentum indicators suggest caution.
Downside risk favored as volatility band constrains outlook
Over the next five sessions, FET is expected to trade within a typical volatility band of $0.1500 – $0.1650. The probability of further gains remains low (less than 20%), with dominant weekly technical indicators favoring a downside or sideways consolidation. A clear breakout above $0.1624 could open the door for a short-term move to the upper end of the range, while sustained losses below $0.1500 would reinforce selling pressure and increase the likelihood of further declines.
Previously it was reported that Fetch.ai is trading well below its key moving averages, with bearish momentum dominating across all major timeframes and technical indicators, including MACD, ADX, and mild oversold readings from RSI and CCI. Immediate resistance is identified at the Ichimoku Kijun level, while current price action suggests likely consolidation within a lower range amid persistent downside pressure and limited rebound prospects.


Latest FET News


-
 Afghanistan
-
 Albania
-
 Algeria
-
 Angola
-
 Argentina
-
 Armenia
-
 Australia
-
 Austria
-
 Azerbaijan
-
 Bahamas
-
 Bahrain
-
 Bangladesh
-
 Belarus
-
 Belgium
-
 Bolivia
-
 Botswana
-
 Brazil
-
 Brunei
-
 Bulgaria
-
 Cambodia
-
 Cameroon
-
 Canada
-
 Chile
Chile
-
 China
China
-
 Colombia
-
 Congo
Congo
-
 Costa Rica
-
 Cote d'Ivoire
-
 Croatia
-
 Cuba
Cuba
-
 Cyprus
-
 Czechia
-
 DR Congo
-
 Denmark
-
 Dominican Republic
-
 Ecuador
-
 Egypt
Egypt
-
 El Salvador
-
 Estonia
-
 Eswatini
-
 Ethiopia
-
 Finland
-
 France
-
 Georgia
-
 Germany
-
 Ghana
Ghana
-
 Greece
-
 Haiti
Haiti
-
 Hong Kong
-
 Hungary
-
 India
India
-
 Indonesia
-
 Iran, Islamic republic
-
 Iraq
Iraq
-
 Ireland
-
 Israel
-
 Italy
Italy
-
 Jamaica
-
 Japan
Japan
-
 Jordan
-
 Kazakhstan
-
 Kenya
Kenya
-
 Korea
Korea
-
 Kuwait
-
 Kyrgyzstan
-
 Laos
Laos
-
 Latvia
-
 Lebanon
-
 Lesotho
-
 Libya
Libya
-
 Lithuania
-
 Luxembourg
-
 Madagascar
-
 Malaysia
-
 Malta
Malta
-
 Mauritius
-
 Mexico
-
 Moldova
-
 Mongolia
-
 Montenegro
-
 Morocco
-
 Mozambique
-
 Myanmar
-
 Namibia
-
 Nepal
Nepal
-
 Netherlands
-
 New Zealand
-
 Nigeria
-
 North Macedonia
-
 Norway
-
 Oman
Oman
-
 Pakistan
-
 Palestine
-
 Panama
-
 Papua New Guinea
-
 Paraguay
-
 Peru
Peru
-
 Philippines
-
 Poland
-
 Portugal
-
 Puerto Rico
-
 Qatar
Qatar
-
 Reunion
-
 Romania
-
 Rwanda
-
 Saudi Arabia
-
 Serbia
-
 Singapore
-
 Slovakia
-
 Slovenia
-
 Somalia
-
 South Africa
-
 Spain
Spain
-
 Sri Lanka
-
 Sweden
-
 Switzerland
-
 Syria
Syria
-
 Taiwan
-
 Tajikistan
-
 Tanzania
-
 Thailand
-
 Trinidad and Tobago
-
 Tunisia
-
 Turkey
-
 UAE
UAE
-
 Uganda
-
 Ukraine
-
 United Kingdom
-
United States
-
 Uruguay
-
 Uzbekistan
-
 Venezuela
-
 Vietnam
-
 Yemen
Yemen
-
 Zambia
-
 Zimbabwe
- Forex
- Crypto
