
Fetch.ai: Mixed technical signals power daily rise, but upside may be limited

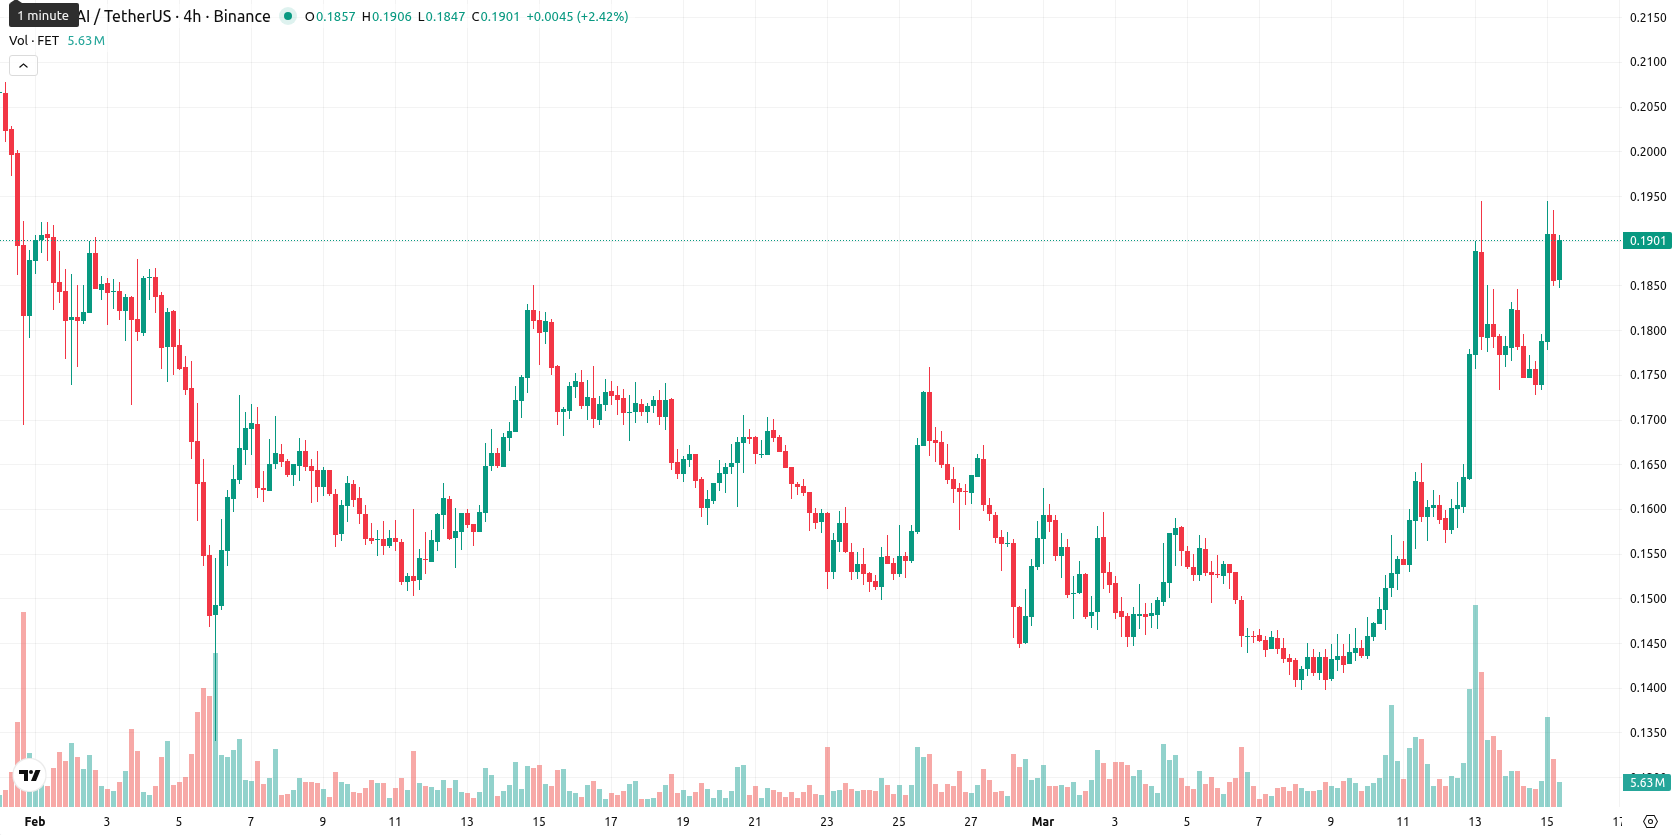
Fetch.ai (FET) is trading at $0.1902, up 7.09% on the day. The price stands above the SMA-20 ($0.1565) and SMA-50 ($0.1710), but well below the SMA-200 ($0.3163), signaling upward short- and medium-term momentum, while the longer-term view remains negative. The Ichimoku Kijun level at $0.1671 offers immediate support.
Highlights
- FET maintains short- and medium-term upward momentum, trading above short-term moving averages despite a bearish long-term setup.
- Momentum indicators are mixed, with RSI and CCI suggesting overbought conditions and a heightened risk of short-term reversal.
- FET is likely to consolidate between $0.1710 and $0.2100 in the coming week, with downside favored unless a breakout occurs.
Overbought momentum diverges from strong upward trend signals
Momentum indicators on the daily chart are mixed. The ADX (24.87) suggests increasing trend strength, and the MACD is neutral, showing that upside momentum is still evolving. The RSI is bullish at 60.6, while both the CCI (179.3) and Stoch RSI (100) are extremely overbought, which points to possible short-term exhaustion or reversal risk. BBP remains positive, indicating dominant buyer activity, and the price is currently near the session highs after a volatile trading session. This high level of momentum paired with overbought oscillators highlights a divergence between price movement and underlying momentum.
Bearish bias prevails as breakouts hinge on key levels
For the coming week, FET is likely to trade within a typical volatility band between $0.1710 and $0.2100. The probability of a price increase is low (less than 20%), with a higher likelihood of pullback, given weekly moving averages and oscillators point to a bearish bias. The baseline scenario is for FET to consolidate between immediate support at $0.1670 and resistance at $0.2100. A breakout above $0.2100 could drive further gains, while a drop below $0.1710 would open risk for further downside toward the mid-$0.1600s.
Earlier, analysts noted that Fetch.ai exhibited strong short- and medium-term momentum while remaining under long-term downside pressure, with buyers dominating despite the risk of near-term exhaustion. The latest developments reinforce this mixed outlook, as continued overbought signals and persistent volatility suggest traders should monitor for a potential pullback or reversal near the $0.2100 resistance.


-
 Afghanistan
-
 Albania
-
 Algeria
-
 Angola
-
 Argentina
-
 Armenia
-
 Australia
-
 Austria
-
 Azerbaijan
-
 Bahamas
-
 Bahrain
-
 Bangladesh
-
 Belarus
-
 Belgium
-
 Bolivia
-
 Botswana
-
 Brazil
-
 Brunei
-
 Bulgaria
-
 Cambodia
-
 Cameroon
-
 Canada
-
 Chile
Chile
-
 China
China
-
 Colombia
-
 Congo
Congo
-
 Costa Rica
-
 Cote d'Ivoire
-
 Croatia
-
 Cuba
Cuba
-
 Cyprus
-
 Czechia
-
 DR Congo
-
 Denmark
-
 Dominican Republic
-
 Ecuador
-
 Egypt
Egypt
-
 El Salvador
-
 Estonia
-
 Eswatini
-
 Ethiopia
-
 Finland
-
 France
-
 Georgia
-
 Germany
-
 Ghana
Ghana
-
 Greece
-
 Haiti
Haiti
-
 Hong Kong
-
 Hungary
-
 India
India
-
 Indonesia
-
 Iran, Islamic republic
-
 Iraq
Iraq
-
 Ireland
-
 Israel
-
 Italy
Italy
-
 Jamaica
-
 Japan
Japan
-
 Jordan
-
 Kazakhstan
-
 Kenya
Kenya
-
 Korea
Korea
-
 Kuwait
-
 Kyrgyzstan
-
 Laos
Laos
-
 Latvia
-
 Lebanon
-
 Lesotho
-
 Libya
Libya
-
 Lithuania
-
 Luxembourg
-
 Madagascar
-
 Malaysia
-
 Malta
Malta
-
 Mauritius
-
 Mexico
-
 Moldova
-
 Mongolia
-
 Montenegro
-
 Morocco
-
 Mozambique
-
 Myanmar
-
 Namibia
-
 Nepal
Nepal
-
 Netherlands
-
 New Zealand
-
 Nigeria
-
 North Macedonia
-
 Norway
-
 Oman
Oman
-
 Pakistan
-
 Palestine
-
 Panama
-
 Papua New Guinea
-
 Paraguay
-
 Peru
Peru
-
 Philippines
-
 Poland
-
 Portugal
-
 Puerto Rico
-
 Qatar
Qatar
-
 Reunion
-
 Romania
-
 Rwanda
-
 Saudi Arabia
-
 Serbia
-
 Singapore
-
 Slovakia
-
 Slovenia
-
 Somalia
-
 South Africa
-
 Spain
Spain
-
 Sri Lanka
-
 Sweden
-
 Switzerland
-
 Syria
Syria
-
 Taiwan
-
 Tajikistan
-
 Tanzania
-
 Thailand
-
 Trinidad and Tobago
-
 Tunisia
-
 Turkey
-
 UAE
UAE
-
 Uganda
-
 Ukraine
-
 United Kingdom
-
United States
-
 Uruguay
-
 Uzbekistan
-
 Venezuela
-
 Vietnam
-
 Yemen
Yemen
-
 Zambia
-
 Zimbabwe
- Forex
- Crypto
