
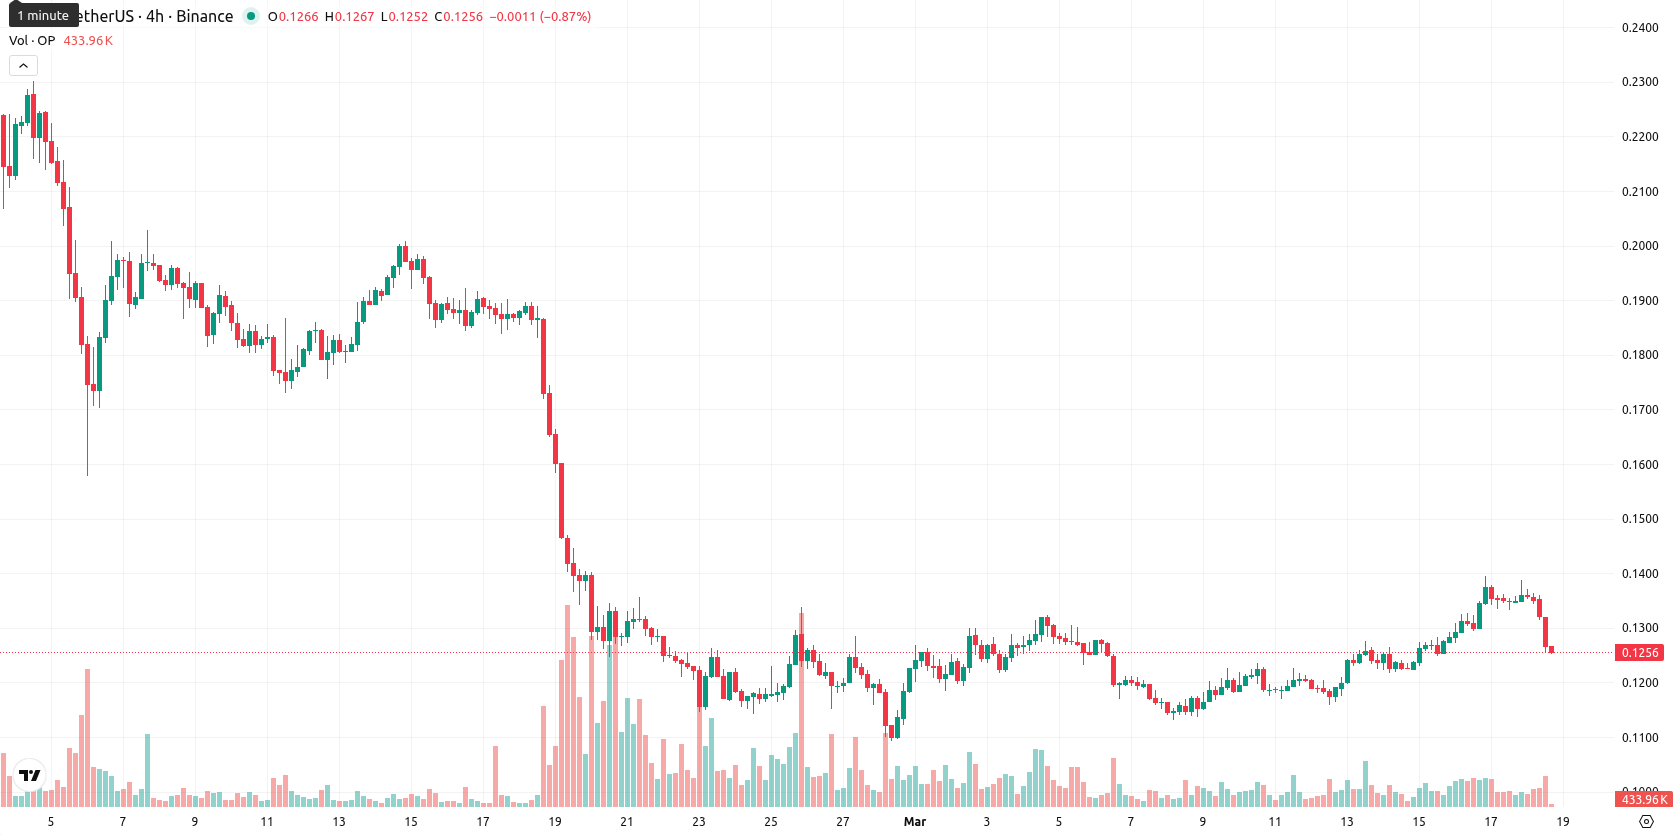
-7.16% for Optimism as selling pressure drives price below key moving averages

Optimism (OP) is trading at $0.1258, having fallen 7.16% today. The price sits just above the SMA-20 at $0.1234, but remains well below the SMA-50 at $0.1646 and SMA-200 at $0.3819, reflecting short-term stabilization within a broader medium- and long-term downtrend.
Highlights
- OP is stabilizing short term but remains in a pronounced medium- and long-term downtrend, suggesting ongoing bearish sentiment.
- Technical momentum remains negative, with selling pressure persisting and most indicators confirming a decisively bearish bias.
- Expected trading range for the next five days is $0.1100 to $0.1400, with a high probability of further downside if $0.1100 support breaks.
Overbought oscillators diverge from sustained bearish momentum
Technically, the Ichimoku Kijun level at $0.1247 offers immediate support just below current pricing. Momentum signals are negative across the board, with MACD and ADX indicating continued selling pressure on both daily and weekly timeframes. The RSI is just below 50, while the CCI and Stoch RSI reflect overbought conditions, suggesting a pullback may be possible even with sustained bearish momentum. BBP is marginally positive, pointing to slight buyer activity, but price action remains decisively bearish, characterized by high intraday volatility and persistent selling from the open; notable divergence is observed as overbought oscillators contrast with continuing downside momentum.
Downside risk prevails as sellers enforce consolidation range
In the short term, OP is likely to trade within a volatility band of $0.1100 – $0.1400, or roughly ±12% relative to current levels. Given prevailing market conditions, the probability of further price declines is estimated above 80%. The baseline scenario favors consolidation within this range as sellers dominate. A break above $0.1400 could indicate a move toward higher resistance, while a drop below $0.1100 may accelerate losses toward lower support.
Earlier, analysts noted that Optimism was experiencing persistent bearish momentum within a medium- to long-term downtrend, with short-term recoveries lacking conviction. The latest price action not only reinforces this cautious outlook but also increases the significance of the $0.1100 support level as a critical threshold to monitor for potential accelerated downside.


Latest Optimism News


-
 Afghanistan
-
 Albania
-
 Algeria
-
 Angola
-
 Argentina
-
 Armenia
-
 Australia
-
 Austria
-
 Azerbaijan
-
 Bahamas
-
 Bahrain
-
 Bangladesh
-
 Belarus
-
 Belgium
-
 Bolivia
-
 Botswana
-
 Brazil
-
 Brunei
-
 Bulgaria
-
 Cambodia
-
 Cameroon
-
 Canada
-
 Chile
Chile
-
 China
China
-
 Colombia
-
 Congo
Congo
-
 Costa Rica
-
 Cote d'Ivoire
-
 Croatia
-
 Cuba
Cuba
-
 Cyprus
-
 Czechia
-
 DR Congo
-
 Denmark
-
 Dominican Republic
-
 Ecuador
-
 Egypt
Egypt
-
 El Salvador
-
 Estonia
-
 Eswatini
-
 Ethiopia
-
 Finland
-
 France
-
 Georgia
-
 Germany
-
 Ghana
Ghana
-
 Greece
-
 Haiti
Haiti
-
 Hong Kong
-
 Hungary
-
 India
India
-
 Indonesia
-
 Iran, Islamic republic
-
 Iraq
Iraq
-
 Ireland
-
 Israel
-
 Italy
Italy
-
 Jamaica
-
 Japan
Japan
-
 Jordan
-
 Kazakhstan
-
 Kenya
Kenya
-
 Korea
Korea
-
 Kuwait
-
 Kyrgyzstan
-
 Laos
Laos
-
 Latvia
-
 Lebanon
-
 Lesotho
-
 Libya
Libya
-
 Lithuania
-
 Luxembourg
-
 Madagascar
-
 Malaysia
-
 Malta
Malta
-
 Mauritius
-
 Mexico
-
 Moldova
-
 Mongolia
-
 Montenegro
-
 Morocco
-
 Mozambique
-
 Myanmar
-
 Namibia
-
 Nepal
Nepal
-
 Netherlands
-
 New Zealand
-
 Nigeria
-
 North Macedonia
-
 Norway
-
 Oman
Oman
-
 Pakistan
-
 Palestine
-
 Panama
-
 Papua New Guinea
-
 Paraguay
-
 Peru
Peru
-
 Philippines
-
 Poland
-
 Portugal
-
 Puerto Rico
-
 Qatar
Qatar
-
 Reunion
-
 Romania
-
 Rwanda
-
 Saudi Arabia
-
 Serbia
-
 Singapore
-
 Slovakia
-
 Slovenia
-
 Somalia
-
 South Africa
-
 Spain
Spain
-
 Sri Lanka
-
 Sweden
-
 Switzerland
-
 Syria
Syria
-
 Taiwan
-
 Tajikistan
-
 Tanzania
-
 Thailand
-
 Trinidad and Tobago
-
 Tunisia
-
 Turkey
-
 UAE
UAE
-
 Uganda
-
 Ukraine
-
 United Kingdom
-
United States
-
 Uruguay
-
 Uzbekistan
-
 Venezuela
-
 Vietnam
-
 Yemen
Yemen
-
 Zambia
-
 Zimbabwe
- Forex
- Crypto
