
Bitcoin price prediction: Can volatility band hold? BTC slides 4.26%

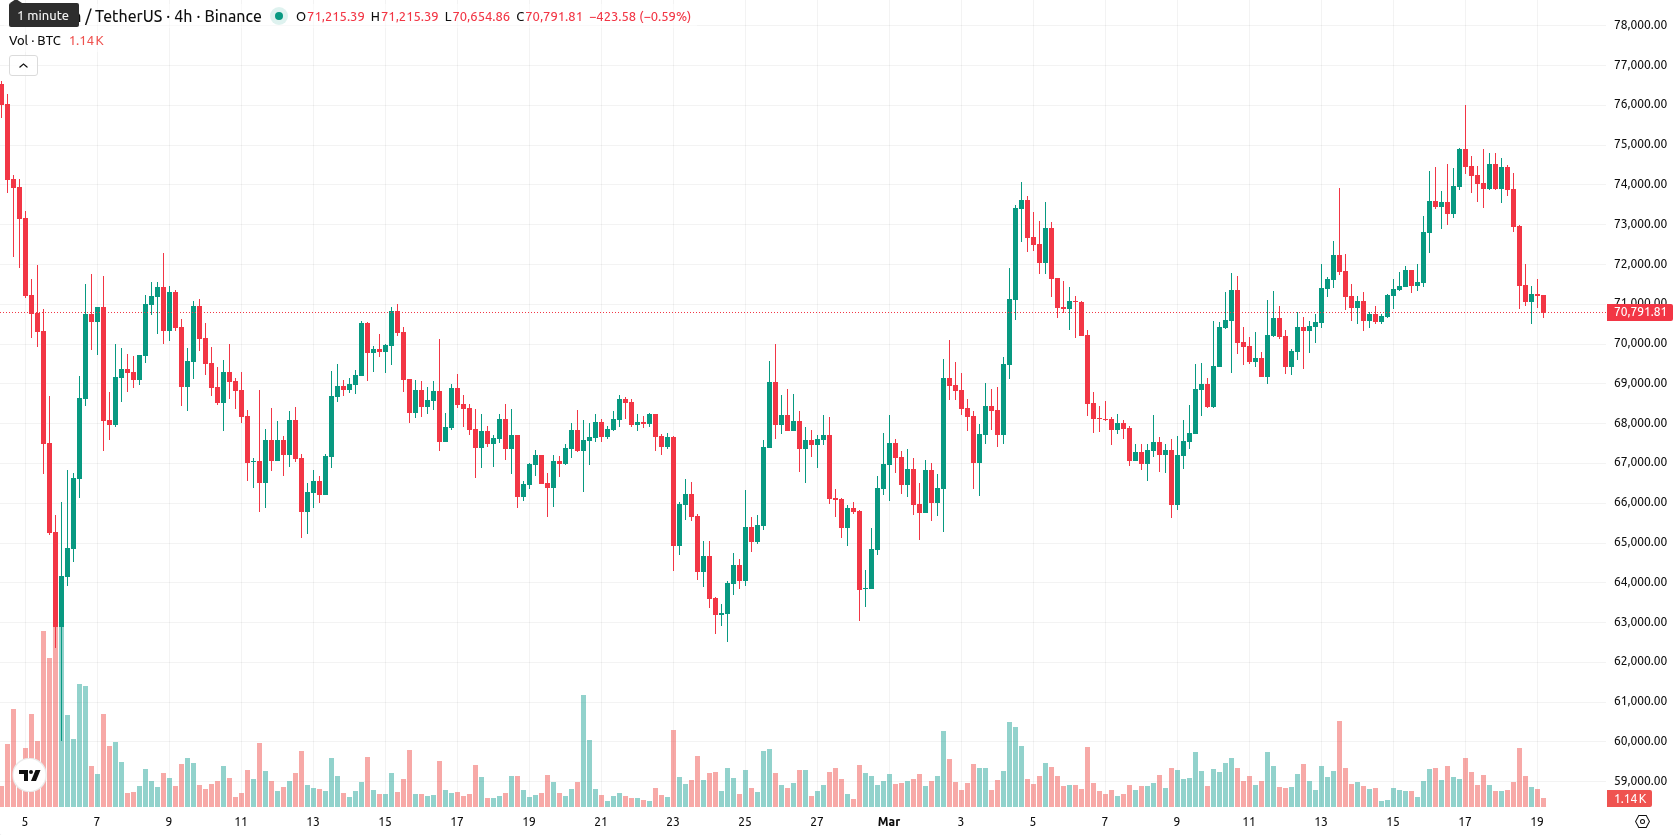
Bitcoin (BTC) is trading at $70,796.09, positioned just above the MA-50 ($70,540.46) and MA-20 ($69,739.39), though notably below the MA-200 ($93,400.98). This signals a phase of short- and medium-term consolidation, while sustained long-term downside risk remains evident.
Highlights
- Bitcoin spot ETFs saw $201.62 million in net inflows on March 16, maintaining positive momentum for six consecutive days.
- Ongoing regulatory developments and new compliance requirements in the US are shaping the landscape for Bitcoin platforms and products.
- Technicals indicate consolidation within a $69,000–$72,000 range, with high volatility and a greater probability of downside as short-term weakness dominates.
ETF inflows strengthen as new compliance rules shape sentiment
On March 16, Bitcoin spot ETFs recorded $201.62 million in net inflows, marking six consecutive days of positive flows as multiple financial institutions have launched Bitcoin ETFs over the past two years. Regulatory discussions and state-level rules in the US are introducing new compliance requirements for Bitcoin-related platforms and products. Though price action has remained under broader selling pressure.
Mixed momentum and high volatility signal near-term weakness
The Ichimoku Kijun level stands at $69,255.14, providing immediate support just below the current price. Momentum indicators present a mixed outlook: D1 MACD and ADX point to underlying buying interest, while D1 RSI and CCI show modest positivity. However, intraday indicators including Stoch RSI and BBP indicate strong selling or oversold conditions, and the Awesome Oscillator is neutral. Notably, Wednesday opened substantially lower without an upward gap, and the price has moved down 4.26% intraday. High volatility and persisting sell pressure reinforce short-term weakness.
Sideways range expected as upside probability drops
Over the next five sessions, BTC is expected to move within a $69,000 to $72,000 volatility band relative to current levels, with sideways price action likely given mixed signals from volatility and momentum indicators. The probability of a price increase is low (less than 20%), as multiple weekly indicators such as MA, RSI, ADX, and MACD issue 'Sell' signals. The baseline scenario is for BTC to consolidate in a narrow band between key support and resistance levels. A break above $71,400 could trigger further upside, while a drop below $69,000 would likely accelerate losses toward lower supports.
Earlier, analysts noted that sovereign entities like Bhutan have become more proactive in managing Bitcoin reserves, signaling a broader shift toward institutional asset management practices. Against this backdrop, traders should closely monitor potential shifts in inflows and regulatory updates, as these factors may amplify volatility and influence whether Bitcoin decisively breaks above resistance or accelerates downward momentum.


Latest Bitcoin News


-
 Afghanistan
-
 Albania
-
 Algeria
-
 Angola
-
 Argentina
-
 Armenia
-
 Australia
-
 Austria
-
 Azerbaijan
-
 Bahamas
-
 Bahrain
-
 Bangladesh
-
 Belarus
-
 Belgium
-
 Bolivia
-
 Botswana
-
 Brazil
-
 Brunei
-
 Bulgaria
-
 Cambodia
-
 Cameroon
-
 Canada
-
 Chile
Chile
-
 China
China
-
 Colombia
-
 Congo
Congo
-
 Costa Rica
-
 Cote d'Ivoire
-
 Croatia
-
 Cuba
Cuba
-
 Cyprus
-
 Czechia
-
 DR Congo
-
 Denmark
-
 Dominican Republic
-
 Ecuador
-
 Egypt
Egypt
-
 El Salvador
-
 Estonia
-
 Eswatini
-
 Ethiopia
-
 Finland
-
 France
-
 Georgia
-
 Germany
-
 Ghana
Ghana
-
 Greece
-
 Haiti
Haiti
-
 Hong Kong
-
 Hungary
-
 India
India
-
 Indonesia
-
 Iran, Islamic republic
-
 Iraq
Iraq
-
 Ireland
-
 Israel
-
 Italy
Italy
-
 Jamaica
-
 Japan
Japan
-
 Jordan
-
 Kazakhstan
-
 Kenya
Kenya
-
 Korea
Korea
-
 Kuwait
-
 Kyrgyzstan
-
 Laos
Laos
-
 Latvia
-
 Lebanon
-
 Lesotho
-
 Libya
Libya
-
 Lithuania
-
 Luxembourg
-
 Madagascar
-
 Malaysia
-
 Malta
Malta
-
 Mauritius
-
 Mexico
-
 Moldova
-
 Mongolia
-
 Montenegro
-
 Morocco
-
 Mozambique
-
 Myanmar
-
 Namibia
-
 Nepal
Nepal
-
 Netherlands
-
 New Zealand
-
 Nigeria
-
 North Macedonia
-
 Norway
-
 Oman
Oman
-
 Pakistan
-
 Palestine
-
 Panama
-
 Papua New Guinea
-
 Paraguay
-
 Peru
Peru
-
 Philippines
-
 Poland
-
 Portugal
-
 Puerto Rico
-
 Qatar
Qatar
-
 Reunion
-
 Romania
-
 Rwanda
-
 Saudi Arabia
-
 Serbia
-
 Singapore
-
 Slovakia
-
 Slovenia
-
 Somalia
-
 South Africa
-
 Spain
Spain
-
 Sri Lanka
-
 Sweden
-
 Switzerland
-
 Syria
Syria
-
 Taiwan
-
 Tajikistan
-
 Tanzania
-
 Thailand
-
 Trinidad and Tobago
-
 Tunisia
-
 Turkey
-
 UAE
UAE
-
 Uganda
-
 Ukraine
-
 United Kingdom
-
United States
-
 Uruguay
-
 Uzbekistan
-
 Venezuela
-
 Vietnam
-
 Yemen
Yemen
-
 Zambia
-
 Zimbabwe
- Forex
- Crypto
