
Optimism: Selling pressure and weak oscillators drive further decline

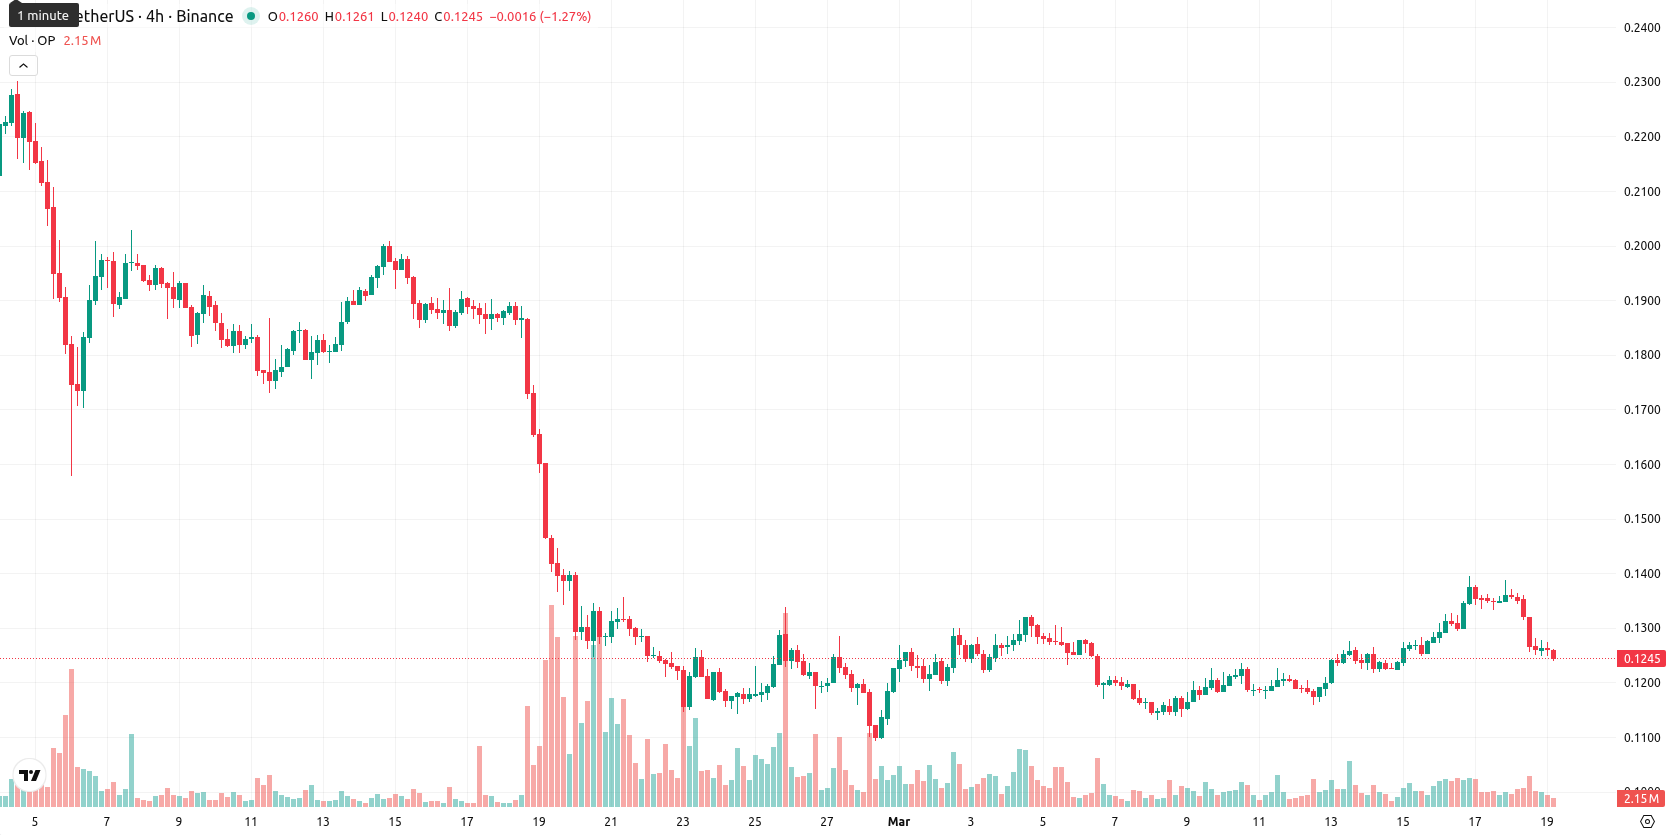
Optimism (OP) is trading at $0.1244 after a daily loss of 8.06%, sitting just above the SMA-20 of $0.1237 but below the SMA-50 at $0.1610 and SMA-200 at $0.3789. The asset shows some short-term stabilization while remaining under medium- and long-term bearish pressure, with the Ichimoku Kijun matching the current price and offering no immediate directional signal.
Highlights
- OP trades near $0.1244, stabilizing short term but remaining well below key medium- and long-term resistance levels.
- Momentum and trend indicators overwhelmingly support the prevailing bearish direction, with pronounced selling pressure dominating recent sessions.
- In the next five days, OP is likely to fluctuate between $0.1100 and $0.1350, with an over 80% probability of further downside.
Mixed oscillator signals as selling momentum dominates near range lows
On the technical side, OP is enduring strong selling momentum as confirmed by daily MACD and ADX, with a trend bias to the downside. Intraday, RSI remains below 50 in the sell zone, Stoch RSI is neutral, and CCI shows a mild buy while hovering near oversold, highlighting mixed oscillator signals. The Bull/Bear Power (BBP) indicates a weak buy but is near neutral levels, while the Awesome Oscillator is neutral and does not confirm the trend; the price currently trades near the low end of the daily range with elevated volatility and no significant gap at the open.
Downside risk prevails as volatility drives range-bound outlook
Typical volatility for the next five days is expected to keep OP in a $0.1100 – $0.1350 range, coinciding with current price patterns and volatility. There is a very high probability (over 80%) of further downside, with limited chances for a price recovery. The base case sees OP fluctuating between $0.1100 and $0.1350 as sellers continue to be active but encounter resistance at the bottom end. A move above the Ichimoku Kijun and SMA-20 could open a path to $0.1350, while more consistent selling may push the price to test support near $0.1100.
Earlier, analysts noted that Optimism was maintaining short-term stability amid an ongoing medium- to long-term bearish trend. The current data reinforces this outlook, highlighting that until there is a decisive shift in momentum, traders should closely monitor for any sustained break above resistance or a downside extension below the $0.1100 level.


Latest Optimism News


-
 Afghanistan
-
 Albania
-
 Algeria
-
 Angola
-
 Argentina
-
 Armenia
-
 Australia
-
 Austria
-
 Azerbaijan
-
 Bahamas
-
 Bahrain
-
 Bangladesh
-
 Belarus
-
 Belgium
-
 Bolivia
-
 Botswana
-
 Brazil
-
 Brunei
-
 Bulgaria
-
 Cambodia
-
 Cameroon
-
 Canada
-
 Chile
Chile
-
 China
China
-
 Colombia
-
 Congo
Congo
-
 Costa Rica
-
 Cote d'Ivoire
-
 Croatia
-
 Cuba
Cuba
-
 Cyprus
-
 Czechia
-
 DR Congo
-
 Denmark
-
 Dominican Republic
-
 Ecuador
-
 Egypt
Egypt
-
 El Salvador
-
 Estonia
-
 Eswatini
-
 Ethiopia
-
 Finland
-
 France
-
 Georgia
-
 Germany
-
 Ghana
Ghana
-
 Greece
-
 Haiti
Haiti
-
 Hong Kong
-
 Hungary
-
 India
India
-
 Indonesia
-
 Iran, Islamic republic
-
 Iraq
Iraq
-
 Ireland
-
 Israel
-
 Italy
Italy
-
 Jamaica
-
 Japan
Japan
-
 Jordan
-
 Kazakhstan
-
 Kenya
Kenya
-
 Korea
Korea
-
 Kuwait
-
 Kyrgyzstan
-
 Laos
Laos
-
 Latvia
-
 Lebanon
-
 Lesotho
-
 Libya
Libya
-
 Lithuania
-
 Luxembourg
-
 Madagascar
-
 Malaysia
-
 Malta
Malta
-
 Mauritius
-
 Mexico
-
 Moldova
-
 Mongolia
-
 Montenegro
-
 Morocco
-
 Mozambique
-
 Myanmar
-
 Namibia
-
 Nepal
Nepal
-
 Netherlands
-
 New Zealand
-
 Nigeria
-
 North Macedonia
-
 Norway
-
 Oman
Oman
-
 Pakistan
-
 Palestine
-
 Panama
-
 Papua New Guinea
-
 Paraguay
-
 Peru
Peru
-
 Philippines
-
 Poland
-
 Portugal
-
 Puerto Rico
-
 Qatar
Qatar
-
 Reunion
-
 Romania
-
 Rwanda
-
 Saudi Arabia
-
 Serbia
-
 Singapore
-
 Slovakia
-
 Slovenia
-
 Somalia
-
 South Africa
-
 Spain
Spain
-
 Sri Lanka
-
 Sweden
-
 Switzerland
-
 Syria
Syria
-
 Taiwan
-
 Tajikistan
-
 Tanzania
-
 Thailand
-
 Trinidad and Tobago
-
 Tunisia
-
 Turkey
-
 UAE
UAE
-
 Uganda
-
 Ukraine
-
 United Kingdom
-
United States
-
 Uruguay
-
 Uzbekistan
-
 Venezuela
-
 Vietnam
-
 Yemen
Yemen
-
 Zambia
-
 Zimbabwe
- Forex
- Crypto
