
IOTA: Weak trend and resistance overhead drive steep daily loss

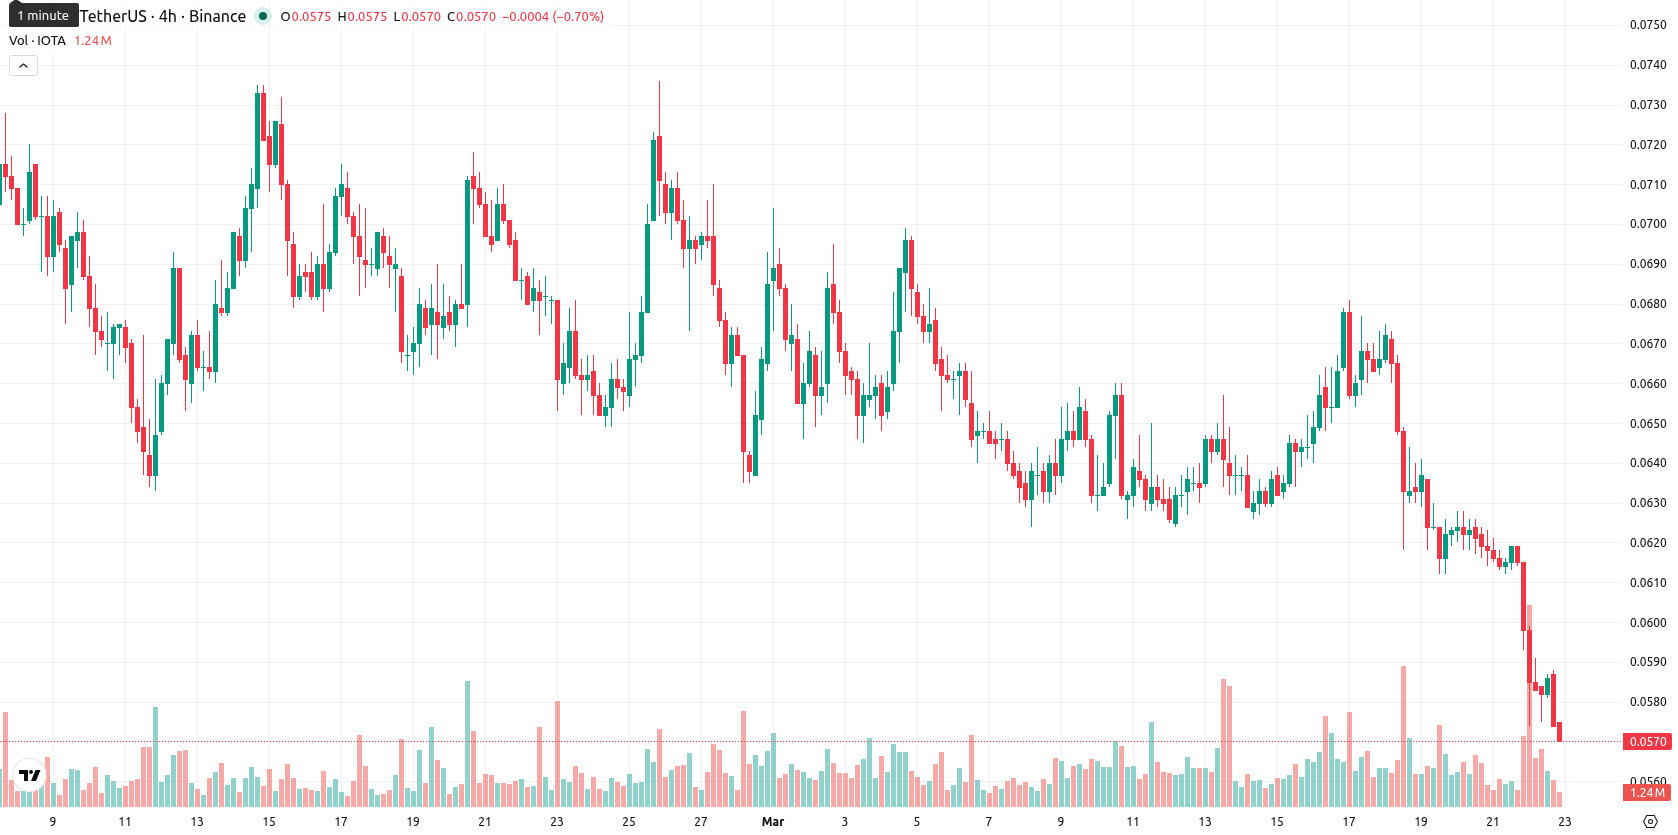
IOTA (IOTA) is trading at $0.0571 after falling 7.04% today, maintaining a position below its SMA-20 ($0.0643), SMA-50 ($0.0674), and SMA-200 ($0.1147), which reflects persistent selling pressure across all key timeframes. The price action remains under the Ichimoku Kijun at $0.0673, pointing to immediate resistance overhead.
Highlights
- IOTA trades persistently below all key moving averages, underscoring strong bearish momentum across all timeframes.
- Short- and medium-term momentum indicators remain negative, with oversold signals suggesting extended selling pressure and weak reversal prospects.
- The expected five-day range is $0.0565–$0.0605, with high probability of further downside unless resistance at $0.0673 is breached.
Bearish momentum confirmed as indicators remain deeply oversold
Momentum indicators remain negative, with the MACD and ADX on the daily chart in sell or neutral territory, supporting a weak and pressured trend. RSI (37.64) and CCI (–145.68) indicate oversold conditions, while the Stoch RSI is at zero, and BBP signals ongoing seller dominance. The Awesome Oscillator confirms this downward momentum. The current price is near today’s low after a volatile session and reinforces the prevailing bearish momentum, as there was no gap between the previous close ($0.0614) and today’s open ($0.0596).
Downside risks prevail as volatility defines direction near support
Over the next five trading days, IOTA is expected to trade within a volatility band of $0.0565 – $0.0605, representing a typical ±7% range relative to current levels. The probability of a price increase is very low (below 20%), so further decline is more likely. The baseline scenario is for IOTA to remain below resistance in a sideways corridor, while a bullish move would require a sustained break above $0.0673 and the upper limit near $0.0605. If support at $0.0565 fails, a new bearish extension is favored as downside risks persist given the strong negative trend signals.
Previously it was reported that IOTA continued to face strong downward momentum, with sellers maintaining control and technical indicators signaling a limited chance of near-term recovery. The latest market action reinforces this bearish outlook, and traders should closely monitor the $0.0565 support level as a breach could trigger a deeper decline in the coming sessions.


Latest IOTA News


-
 Afghanistan
-
 Albania
-
 Algeria
-
 Angola
-
 Argentina
-
 Armenia
-
 Australia
-
 Austria
-
 Azerbaijan
-
 Bahamas
-
 Bahrain
-
 Bangladesh
-
 Belarus
-
 Belgium
-
 Bolivia
-
 Botswana
-
 Brazil
-
 Brunei
-
 Bulgaria
-
 Cambodia
-
 Cameroon
-
 Canada
-
 Chile
Chile
-
 China
China
-
 Colombia
-
 Congo
Congo
-
 Costa Rica
-
 Cote d'Ivoire
-
 Croatia
-
 Cuba
Cuba
-
 Cyprus
-
 Czechia
-
 DR Congo
-
 Denmark
-
 Dominican Republic
-
 Ecuador
-
 Egypt
Egypt
-
 El Salvador
-
 Estonia
-
 Eswatini
-
 Ethiopia
-
 Finland
-
 France
-
 Georgia
-
 Germany
-
 Ghana
Ghana
-
 Greece
-
 Haiti
Haiti
-
 Hong Kong
-
 Hungary
-
 India
India
-
 Indonesia
-
 Iran, Islamic republic
-
 Iraq
Iraq
-
 Ireland
-
 Israel
-
 Italy
Italy
-
 Jamaica
-
 Japan
Japan
-
 Jordan
-
 Kazakhstan
-
 Kenya
Kenya
-
 Korea
Korea
-
 Kuwait
-
 Kyrgyzstan
-
 Laos
Laos
-
 Latvia
-
 Lebanon
-
 Lesotho
-
 Libya
Libya
-
 Lithuania
-
 Luxembourg
-
 Madagascar
-
 Malaysia
-
 Malta
Malta
-
 Mauritius
-
 Mexico
-
 Moldova
-
 Mongolia
-
 Montenegro
-
 Morocco
-
 Mozambique
-
 Myanmar
-
 Namibia
-
 Nepal
Nepal
-
 Netherlands
-
 New Zealand
-
 Nigeria
-
 North Macedonia
-
 Norway
-
 Oman
Oman
-
 Pakistan
-
 Palestine
-
 Panama
-
 Papua New Guinea
-
 Paraguay
-
 Peru
Peru
-
 Philippines
-
 Poland
-
 Portugal
-
 Puerto Rico
-
 Qatar
Qatar
-
 Reunion
-
 Romania
-
 Rwanda
-
 Saudi Arabia
-
 Serbia
-
 Singapore
-
 Slovakia
-
 Slovenia
-
 Somalia
-
 South Africa
-
 Spain
Spain
-
 Sri Lanka
-
 Sweden
-
 Switzerland
-
 Syria
Syria
-
 Taiwan
-
 Tajikistan
-
 Tanzania
-
 Thailand
-
 Trinidad and Tobago
-
 Tunisia
-
 Turkey
-
 UAE
UAE
-
 Uganda
-
 Ukraine
-
 United Kingdom
-
United States
-
 Uruguay
-
 Uzbekistan
-
 Venezuela
-
 Vietnam
-
 Yemen
Yemen
-
 Zambia
-
 Zimbabwe
- Forex
- Crypto
