
Optimism price prediction: $0.1191 resistance in focus? OP gains 7.01%

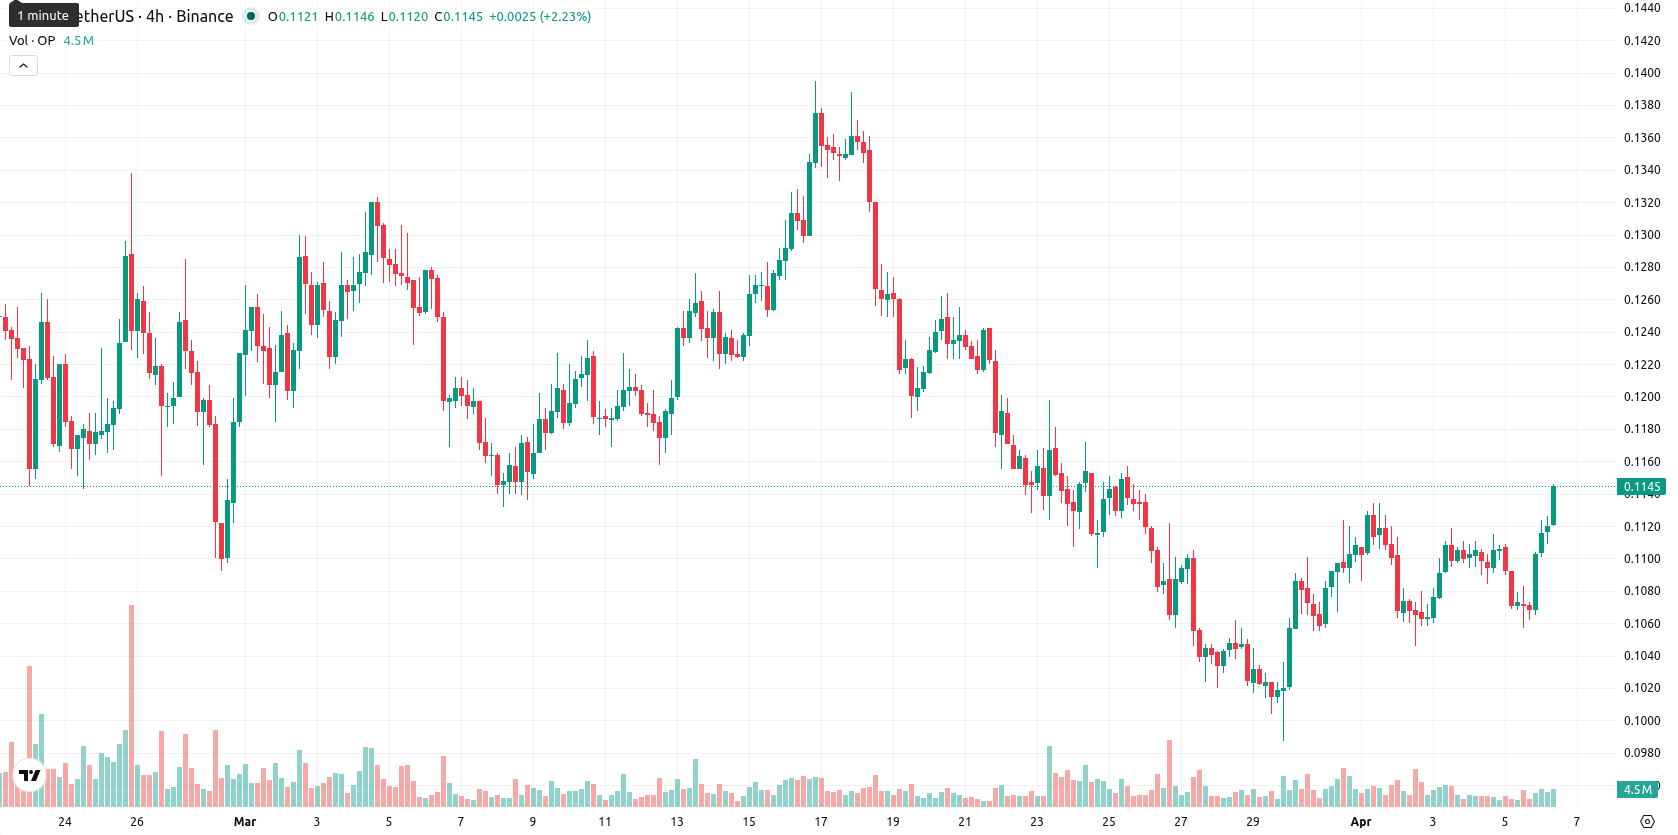
Optimism (OP) is trading at $0.1145, advancing 7.01% since the previous session. The price is currently above the MA-20 ($0.1131) but remains well below the MA-50 ($0.1242) and MA-200 ($0.3217), reflecting short-term bullish momentum against continued medium- and long-term selling pressure.
Highlights
- OP shows short-term bullish momentum, trading above its 20-day moving average but remains below key longer-term averages.
- Momentum signals are mixed, with strong daily selling pressure and overbought intraday indicators raising the risk of a near-term correction.
- Baseline expectation is consolidation between $0.1109 and $0.1157 over five days, with downside risk outweighing further upside.
Mixed technicals as intraday resilience contrasts with bearish momentum
Technical signals are mixed: while OP trades above the MA-20, it is still under the MA-50 and MA-200. The Ichimoku Kijun at $0.1191 serves as immediate resistance; strong selling is evident on the D1 MACD, and the D1 ADX shows a bearish trend with significant strength. D1 RSI is weak at 40.86, indicating no reversal, while the D1 Stoch RSI is extremely overbought, suggesting near-term correction risk; CCI is neutral. BBP is slightly positive, pointing to mild buyer pressure intraday, and the Awesome Oscillator remains neutral. Price action shows low volatility, early-session gains, and sustained strength near the session high, but the divergence with oscillators signals caution on sustainability.
Sideways trading expected as downside risk outweighs upside
For the next five trading days, the typical volatility range is expected between $0.1109 and $0.1157. The chance of a significant upward move remains low (less than 20%), with a higher probability of a decline due to prevailing weekly signals. The baseline scenario calls for sideways trading within this band. A push above $0.1191 would be needed to retest the MA-50, while a break below $0.1109 could expose further medium-term downside.
Earlier, analysts noted that Optimism faced strong and persistent selling pressure with no indication of a bullish reversal. While today’s move shows a brief recovery, mixed technicals and ongoing resistance mean traders should remain cautious, with the risk of a near-term pullback heightened unless the price can sustain a close above the $0.1191 resistance level.


Latest Optimism News


-
 Afghanistan
-
 Albania
-
 Algeria
-
 Angola
-
 Argentina
-
 Armenia
-
 Australia
-
 Austria
-
 Azerbaijan
-
 Bahamas
-
 Bahrain
-
 Bangladesh
-
 Belarus
-
 Belgium
-
 Bolivia
-
 Botswana
-
 Brazil
-
 Brunei
-
 Bulgaria
-
 Cambodia
-
 Cameroon
-
 Canada
-
 Chile
Chile
-
 China
China
-
 Colombia
-
 Congo
Congo
-
 Costa Rica
-
 Cote d'Ivoire
-
 Croatia
-
 Cuba
Cuba
-
 Cyprus
-
 Czechia
-
 DR Congo
-
 Denmark
-
 Dominican Republic
-
 Ecuador
-
 Egypt
Egypt
-
 El Salvador
-
 Estonia
-
 Eswatini
-
 Ethiopia
-
 Finland
-
 France
-
 Georgia
-
 Germany
-
 Ghana
Ghana
-
 Greece
-
 Haiti
Haiti
-
 Hong Kong
-
 Hungary
-
 India
India
-
 Indonesia
-
 Iran, Islamic republic
-
 Iraq
Iraq
-
 Ireland
-
 Israel
-
 Italy
Italy
-
 Jamaica
-
 Japan
Japan
-
 Jordan
-
 Kazakhstan
-
 Kenya
Kenya
-
 Korea
Korea
-
 Kuwait
-
 Kyrgyzstan
-
 Laos
Laos
-
 Latvia
-
 Lebanon
-
 Lesotho
-
 Libya
Libya
-
 Lithuania
-
 Luxembourg
-
 Madagascar
-
 Malaysia
-
 Malta
Malta
-
 Mauritius
-
 Mexico
-
 Moldova
-
 Mongolia
-
 Montenegro
-
 Morocco
-
 Mozambique
-
 Myanmar
-
 Namibia
-
 Nepal
Nepal
-
 Netherlands
-
 New Zealand
-
 Nigeria
-
 North Macedonia
-
 Norway
-
 Oman
Oman
-
 Pakistan
-
 Palestine
-
 Panama
-
 Papua New Guinea
-
 Paraguay
-
 Peru
Peru
-
 Philippines
-
 Poland
-
 Portugal
-
 Puerto Rico
-
 Qatar
Qatar
-
 Reunion
-
 Romania
-
 Rwanda
-
 Saudi Arabia
-
 Serbia
-
 Singapore
-
 Slovakia
-
 Slovenia
-
 Somalia
-
 South Africa
-
 Spain
Spain
-
 Sri Lanka
-
 Sweden
-
 Switzerland
-
 Syria
Syria
-
 Taiwan
-
 Tajikistan
-
 Tanzania
-
 Thailand
-
 Trinidad and Tobago
-
 Tunisia
-
 Turkey
-
 UAE
UAE
-
 Uganda
-
 Ukraine
-
 United Kingdom
-
United States
-
 Uruguay
-
 Uzbekistan
-
 Venezuela
-
 Vietnam
-
 Yemen
Yemen
-
 Zambia
-
 Zimbabwe
- Forex
- Crypto
