
XRP price prediction: Can the $1.37–$1.39 range hold as XRP climbs 5.63%?

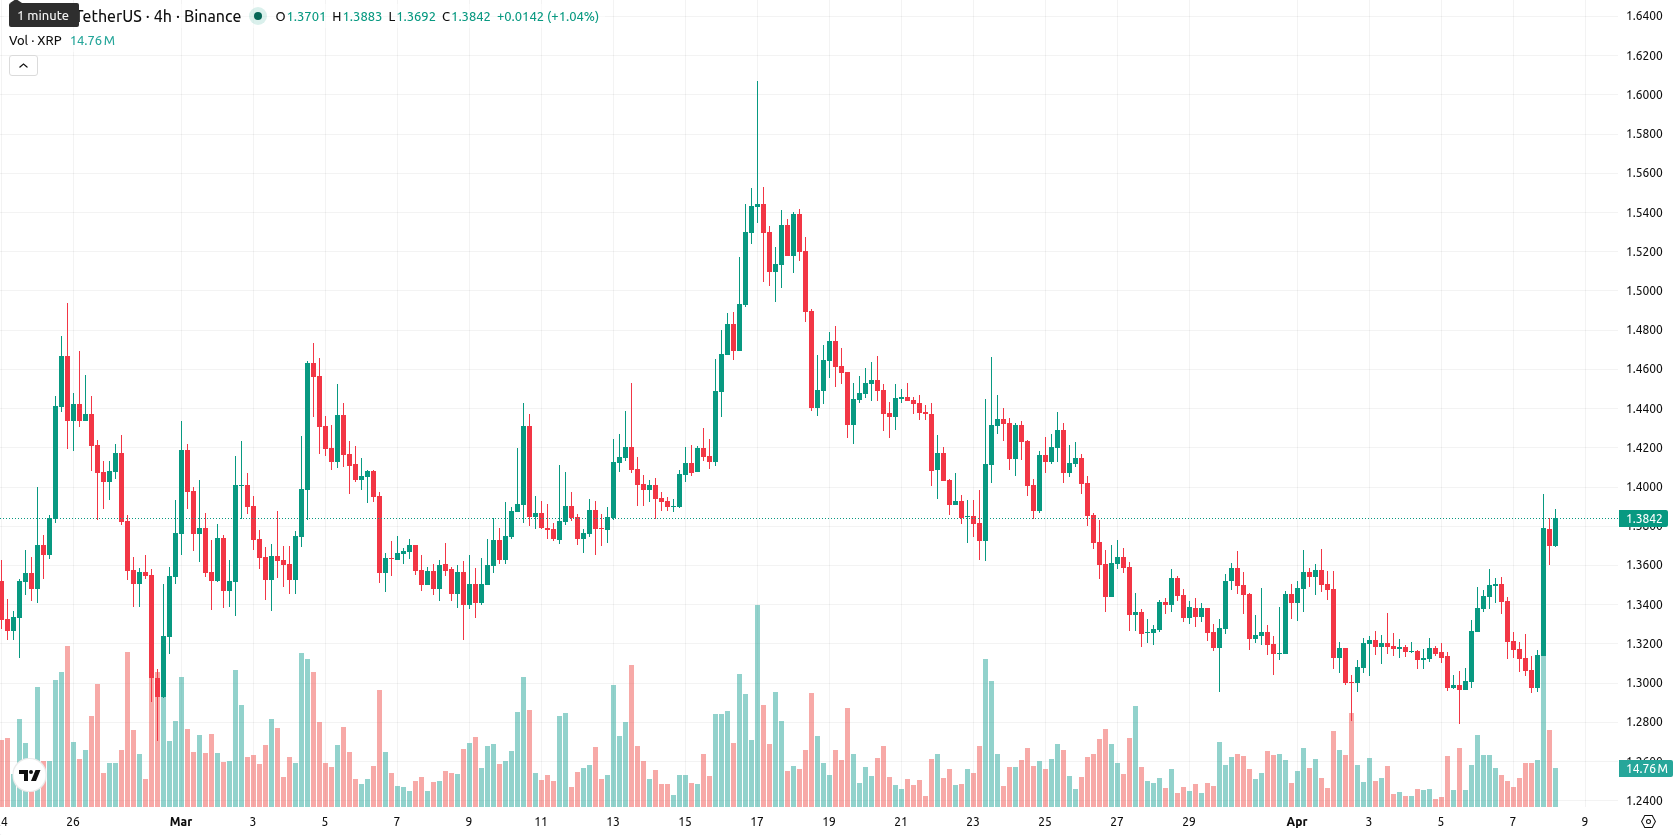
XRP (XRP) is trading at $1.3848, positioned above the MA-20 ($1.3653) but just below the MA-50 ($1.3885) and substantially beneath the MA-200 ($1.9754). This configuration suggests short-term bullish momentum with medium- and longer-term resistance still present; the Ichimoku Kijun at $1.4429 sits above the current price, acting as immediate resistance.
Highlights
- US regulatory clarity classifying XRP as a digital commodity has driven institutional inflows and reduced prior legal risks.
- Spot XRP ETFs attracted over $1 billion in US net inflows since launch, with $224 million added during the latest week.
- XRP trades in a tight $1.37–$1.39 range, with mixed technical indicators signaling weak momentum and a bias toward possible downside.
Institutional inflows rise as regulatory clarity boosts XRP sentiment
Regulatory clarity in Washington, including a joint SEC/CFTC framework classifying XRP as a digital commodity and the passage of the Market Clarity Act in the Senate, has removed significant legal uncertainties previously affecting XRP. Institutional interest has increased, with over $1 billion in net inflows to spot XRP ETFs in the US since their launch. On April 7, 2026, cryptocurrency investment products saw inflows, with XRP leading weekly gains and recording $224 million in inflows. Ripple Labs and related companies are expanding institutional integration and product strategies following this regulatory shift.
Bullish daily bias tempered by oscillators signaling overextension risk
Momentum indicators show mixed signals: the daily MACD signals strong downside risk, while ADX on D1 is neutral, suggesting weak trend strength. RSI reads 53.95 and leans bullish, but Stoch RSI is overbought at 100, highlighting overextension, and CCI is near neutral. BBP points to strong buyer dominance intraday, which aligns with the daily change of 5.63% upward (current price near the daily high at $1.386), opening higher with no price gap from the previous session. The day has seen high volatility and strong upward tone; however, the conflicting oscillators warn that further gains are not guaranteed if momentum reverses.
Sideways trading likely as upside prospects fade on weak momentum
For the next five trading days, the expected range is $1.37 to $1.39, a typical volatility band relative to current levels. The probability of a price increase is very low (less than 20%), making further declines more likely. Baseline scenario: XRP holds in a tight sideways band between $1.37 and $1.39. Bullish scenario: a firm breakout above $1.39 – $1.44 could test higher resistances, but prevailing indicator signals make sustained upside less probable; bearish scenario: a drop below $1.37 may trigger additional downside given bearish momentum on the weekly chart and negative signals from MACD and ADX on W1.
Previously it was reported that XRP faced persistent bearish momentum and subdued institutional participation, with sideways movement favored as the prevailing short-term scenario. The current analysis adds that, despite an uptick in institutional inflows and some short-term bullish signals, conflicting momentum indicators and resistance overhead make the $1.39–$1.44 zone a crucial level to watch for any sustained breakout in the coming sessions.


-
 Afghanistan
-
 Albania
-
 Algeria
-
 Angola
-
 Argentina
-
 Armenia
-
 Australia
-
 Austria
-
 Azerbaijan
-
 Bahamas
-
 Bahrain
-
 Bangladesh
-
 Belarus
-
 Belgium
-
 Bolivia
-
 Botswana
-
 Brazil
-
 Brunei
-
 Bulgaria
-
 Cambodia
-
 Cameroon
-
 Canada
-
 Chile
Chile
-
 China
China
-
 Colombia
-
 Congo
Congo
-
 Costa Rica
-
 Cote d'Ivoire
-
 Croatia
-
 Cuba
Cuba
-
 Cyprus
-
 Czechia
-
 DR Congo
-
 Denmark
-
 Dominican Republic
-
 Ecuador
-
 Egypt
Egypt
-
 El Salvador
-
 Estonia
-
 Eswatini
-
 Ethiopia
-
 Finland
-
 France
-
 Georgia
-
 Germany
-
 Ghana
Ghana
-
 Greece
-
 Haiti
Haiti
-
 Hong Kong
-
 Hungary
-
 India
India
-
 Indonesia
-
 Iran, Islamic republic
-
 Iraq
Iraq
-
 Ireland
-
 Israel
-
 Italy
Italy
-
 Jamaica
-
 Japan
Japan
-
 Jordan
-
 Kazakhstan
-
 Kenya
Kenya
-
 Korea
Korea
-
 Kuwait
-
 Kyrgyzstan
-
 Laos
Laos
-
 Latvia
-
 Lebanon
-
 Lesotho
-
 Libya
Libya
-
 Lithuania
-
 Luxembourg
-
 Madagascar
-
 Malaysia
-
 Malta
Malta
-
 Mauritius
-
 Mexico
-
 Moldova
-
 Mongolia
-
 Montenegro
-
 Morocco
-
 Mozambique
-
 Myanmar
-
 Namibia
-
 Nepal
Nepal
-
 Netherlands
-
 New Zealand
-
 Nigeria
-
 North Macedonia
-
 Norway
-
 Oman
Oman
-
 Pakistan
-
 Palestine
-
 Panama
-
 Papua New Guinea
-
 Paraguay
-
 Peru
Peru
-
 Philippines
-
 Poland
-
 Portugal
-
 Puerto Rico
-
 Qatar
Qatar
-
 Reunion
-
 Romania
-
 Rwanda
-
 Saudi Arabia
-
 Serbia
-
 Singapore
-
 Slovakia
-
 Slovenia
-
 Somalia
-
 South Africa
-
 Spain
Spain
-
 Sri Lanka
-
 Sweden
-
 Switzerland
-
 Syria
Syria
-
 Taiwan
-
 Tajikistan
-
 Tanzania
-
 Thailand
-
 Trinidad and Tobago
-
 Tunisia
-
 Turkey
-
 UAE
UAE
-
 Uganda
-
 Ukraine
-
 United Kingdom
-
United States
-
 Uruguay
-
 Uzbekistan
-
 Venezuela
-
 Vietnam
-
 Yemen
Yemen
-
 Zambia
-
 Zimbabwe
- Forex
- Crypto
