
Pendle price prediction: $1.43–$1.51 level in focus as PENDLE rallies 13.73%

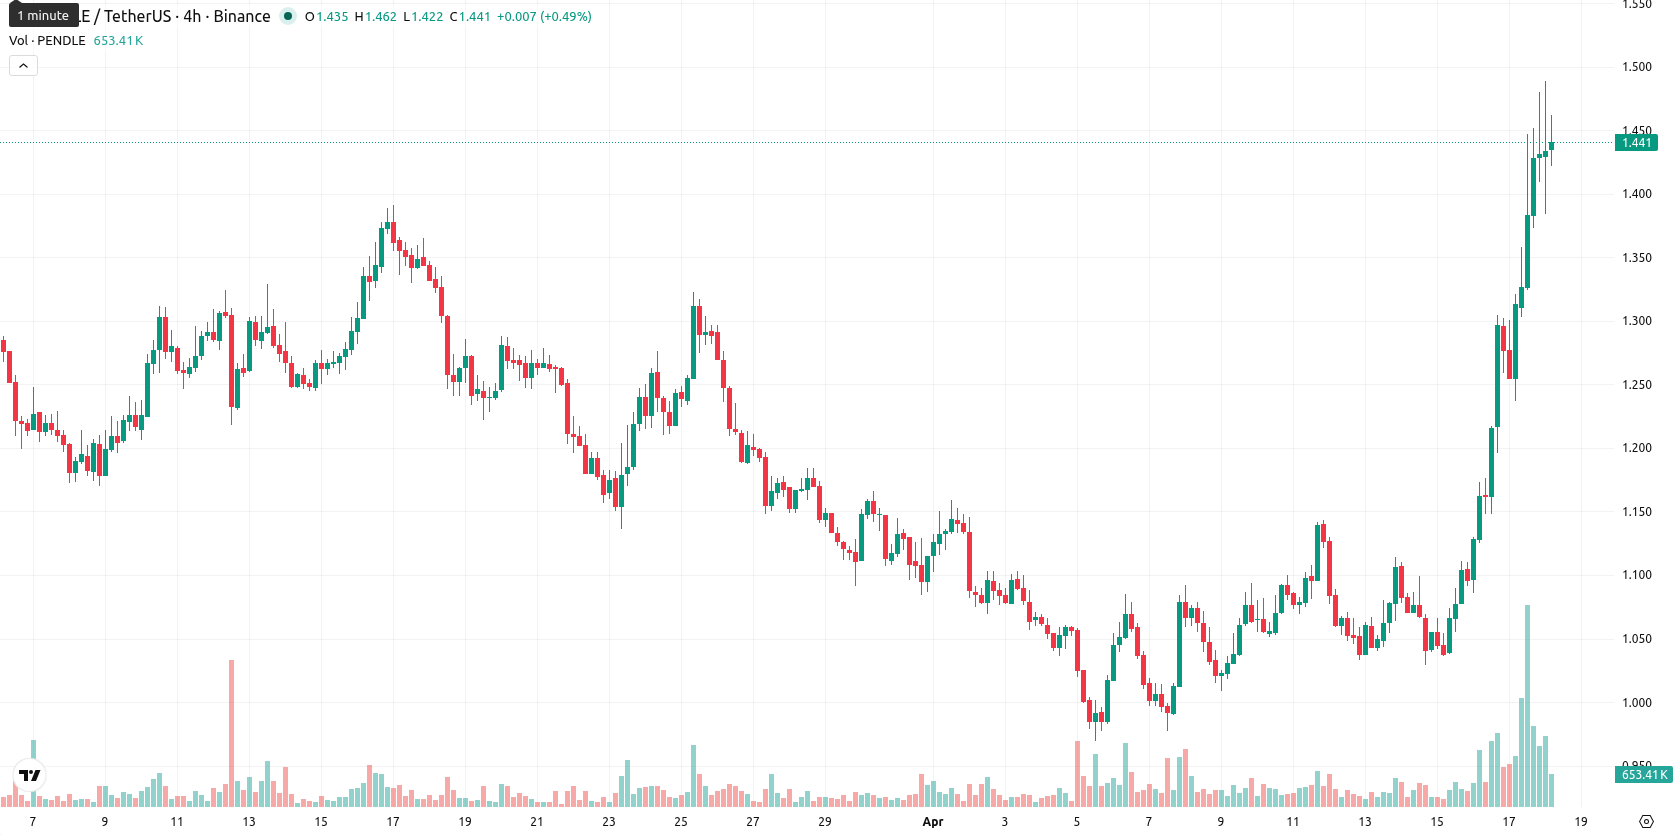
Pendle (PENDLE) is trading at $1.45, up 13.73% on the day. The price is well above the SMA-20 ($1.1052) and SMA-50 ($1.1942), but remains below the long-term SMA-200 ($2.0940), placing Pendle in a strong short- and medium-term bullish posture while long-term sellers still control the upper range.
Highlights
- PENDLE shows strong short- and medium-term bullish momentum but remains structurally fragile under long-term resistance near $2.09.
- Multiple technical indicators flag overbought conditions, with momentum fading and risk of a near-term pullback increasing.
- For the coming week, price is likely to consolidate within the $1.43–$1.51 range, with downside favored over sustained gains.
Bullish momentum risks reversal as oscillators show overextension
Momentum signals are mixed. The ADX (25.76, Buy) indicates a strengthening trend, but the MACD on D1 is Neutral, reflecting ambiguous underlying momentum. RSI (68.40, Buy) is nearing overbought territory, with the CCI (372.41, Overbought) and Stoch RSI (100, Overbought) also warning of stretched bullish conditions. BBP (0.3213, Buy) shows buyers dominating intraday, while the Awesome Oscillator is Neutral. The Ichimoku Kijun on the daily timeframe is at $1.2245 and acts as immediate support. After gapping up from $1.275 to open at $1.43, strong follow-through has driven price near today’s high, with the session ranging between $1.384 and $1.489. The bias is bullish but volatile, with oscillators signaling overextension.
Sideways bias prevails amid waning short-term upside
For the coming week, typical volatility is expected with a range of $1.43 – $1.51, keeping price movement close to current levels. The probability of further upside is low (under 20%), with a greater chance that Pendle consolidates or pulls back, given negative weekly signals (RSI, ADX, MACD, MA-50). The baseline scenario favors sideways trading while short-term gains are absorbed. A move above $1.51 could open room toward higher resistance, but a drop below $1.43 would target immediate support at the Kijun level.
Earlier, analysts noted that Pendle was exhibiting short- to medium-term bullish momentum amid overall market consolidation and mixed technical signals. The current rally further validates this view, but with momentum oscillators now signaling overextension, traders should closely monitor for a pullback or potential exhaustion if resistance near $1.51 holds.


-
 Afghanistan
-
 Albania
-
 Algeria
-
 Angola
-
 Argentina
-
 Armenia
-
 Australia
-
 Austria
-
 Azerbaijan
-
 Bahamas
-
 Bahrain
-
 Bangladesh
-
 Belarus
-
 Belgium
-
 Bolivia
-
 Botswana
-
 Brazil
-
 Brunei
-
 Bulgaria
-
 Cambodia
-
 Cameroon
-
 Canada
-
 Chile
Chile
-
 China
China
-
 Colombia
-
 Congo
Congo
-
 Costa Rica
-
 Cote d'Ivoire
-
 Croatia
-
 Cuba
Cuba
-
 Cyprus
-
 Czechia
-
 DR Congo
-
 Denmark
-
 Dominican Republic
-
 Ecuador
-
 Egypt
Egypt
-
 El Salvador
-
 Estonia
-
 Eswatini
-
 Ethiopia
-
 Finland
-
 France
-
 Georgia
-
 Germany
-
 Ghana
Ghana
-
 Greece
-
 Haiti
Haiti
-
 Hong Kong
-
 Hungary
-
 India
India
-
 Indonesia
-
 Iran, Islamic republic
-
 Iraq
Iraq
-
 Ireland
-
 Israel
-
 Italy
Italy
-
 Jamaica
-
 Japan
Japan
-
 Jordan
-
 Kazakhstan
-
 Kenya
Kenya
-
 Korea
Korea
-
 Kuwait
-
 Kyrgyzstan
-
 Laos
Laos
-
 Latvia
-
 Lebanon
-
 Lesotho
-
 Libya
Libya
-
 Lithuania
-
 Luxembourg
-
 Madagascar
-
 Malaysia
-
 Malta
Malta
-
 Mauritius
-
 Mexico
-
 Moldova
-
 Mongolia
-
 Montenegro
-
 Morocco
-
 Mozambique
-
 Myanmar
-
 Namibia
-
 Nepal
Nepal
-
 Netherlands
-
 New Zealand
-
 Nigeria
-
 North Macedonia
-
 Norway
-
 Oman
Oman
-
 Pakistan
-
 Palestine
-
 Panama
-
 Papua New Guinea
-
 Paraguay
-
 Peru
Peru
-
 Philippines
-
 Poland
-
 Portugal
-
 Puerto Rico
-
 Qatar
Qatar
-
 Reunion
-
 Romania
-
 Rwanda
-
 Saudi Arabia
-
 Serbia
-
 Singapore
-
 Slovakia
-
 Slovenia
-
 Somalia
-
 South Africa
-
 Spain
Spain
-
 Sri Lanka
-
 Sweden
-
 Switzerland
-
 Syria
Syria
-
 Taiwan
-
 Tajikistan
-
 Tanzania
-
 Thailand
-
 Trinidad and Tobago
-
 Tunisia
-
 Turkey
-
 UAE
UAE
-
 Uganda
-
 Ukraine
-
 United Kingdom
-
United States
-
 Uruguay
-
 Uzbekistan
-
 Venezuela
-
 Vietnam
-
 Yemen
Yemen
-
 Zambia
-
 Zimbabwe
- Forex
- Crypto
