
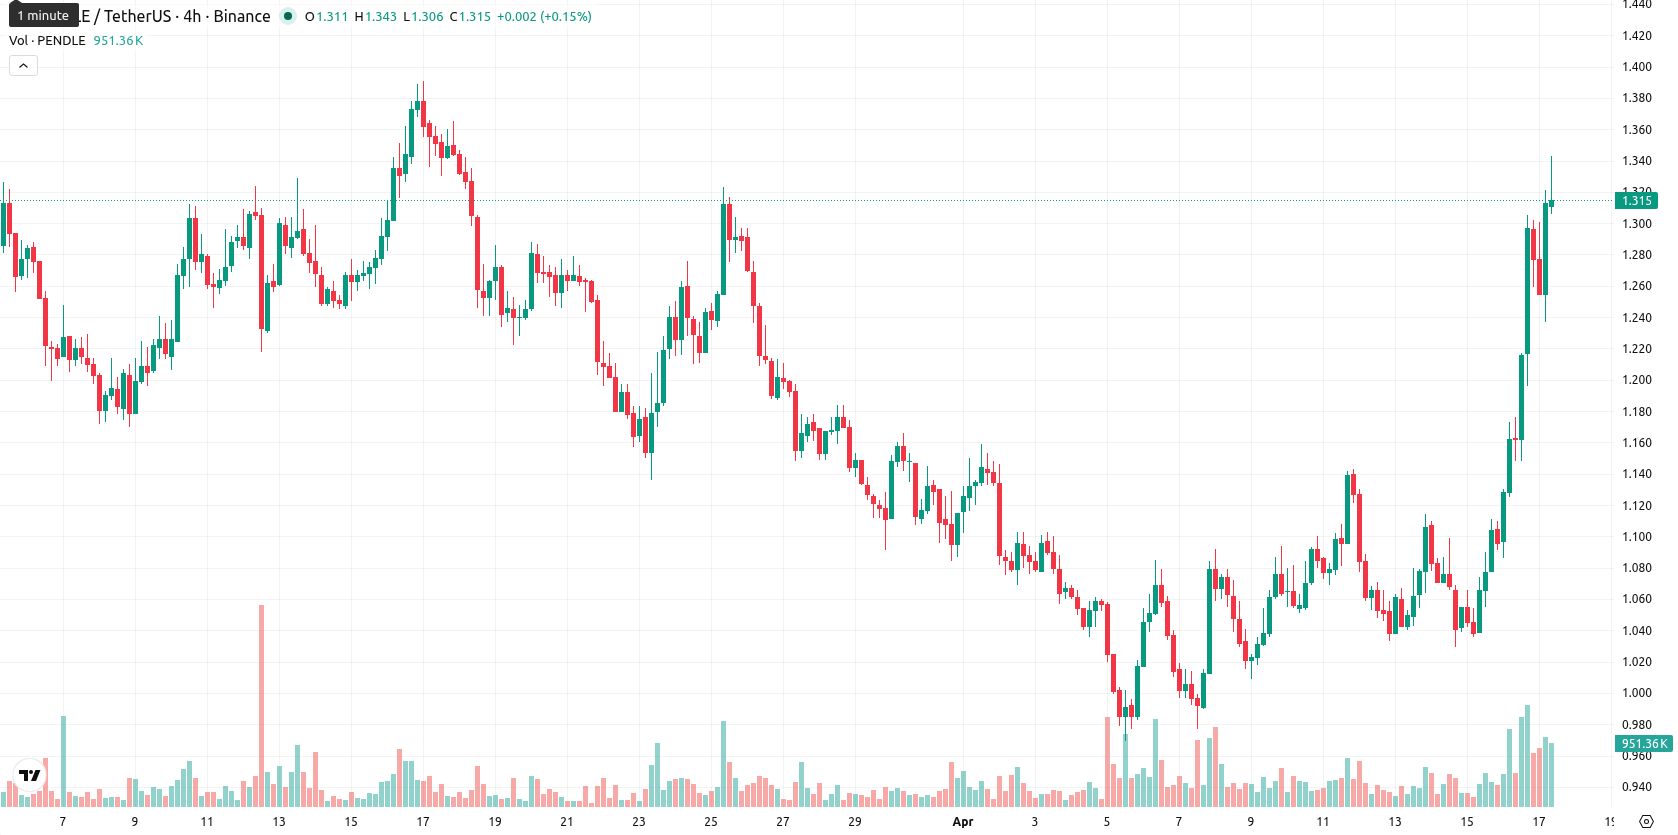
+15.14% for Pendle as strong move faces near-term resistance

Pendle (PENDLE) is trading at $1.331 after surging 15.14% on the day. The asset is positioned above both its SMA-20 ($1.0904) and SMA-50 ($1.1914), but remains below the SMA-200 ($2.1105), highlighting ongoing short- and medium-term bullish momentum while the longer-term trend is still shaped by prior declines.
Highlights
- PENDLE surged 15% after a gap up, trading above key short- and medium-term averages, reflecting strong near-term bullish momentum.
- Despite intraday buyer strength and overbought conditions, weekly indicators flag weak long-term trend and increased downside risk.
- Price is expected to range between $1.29 and $1.38 over the next five days, with a low probability of further gains.
Mixed momentum and overbought signals amid ongoing volatility
Momentum signals for PENDLE are mixed. The ADX (25.72, buy) suggests buyers are gaining control, but the D1 MACD remains firmly in strong sell territory, indicating residual downward pressure despite intraday strength. RSI (60.7, buy) and CCI (239.0, overbought) confirm overbought conditions, echoed by a Stoch RSI fully extended at 100. Bull/Bear Power (BBP) signals robust buyer dominance, and the price remains above the Ichimoku Kijun level ($1.1460), with this now acting as immediate support. The Awesome Oscillator is neutral and does not reinforce the prevailing trend. Strong volatility is present, with a price range of $1.237–$1.34 intraday. Divergences remain between momentum indicators and price action, with volume favoring near-term upward movement.
Downside risk prevails with weak prospects for sustained breakout
In the next 5 trading days, PENDLE is likely to see typical volatility within a $1.29 to $1.38 band. The probability of sustained upside movement is very low (under 20%), with signals from the weekly MACD, ADX, and RSI favoring downside risk. The baseline scenario points to sideways movement within this corridor as short-term buyers and longer-term sellers offset each other. A break above $1.34 could target further gains, while a dip below $1.29 would likely trigger additional selling pressure.
Earlier, analysts noted that Pendle was demonstrating short- to medium-term bullish momentum, though broader market dynamics pointed toward consolidation. With recent price action and continued mixed signals across key technical indicators, the outlook now hinges on a potential breakout above $1.34 as a trigger for short-term direction.


-
 Afghanistan
-
 Albania
-
 Algeria
-
 Angola
-
 Argentina
-
 Armenia
-
 Australia
-
 Austria
-
 Azerbaijan
-
 Bahamas
-
 Bahrain
-
 Bangladesh
-
 Belarus
-
 Belgium
-
 Bolivia
-
 Botswana
-
 Brazil
-
 Brunei
-
 Bulgaria
-
 Cambodia
-
 Cameroon
-
 Canada
-
 Chile
Chile
-
 China
China
-
 Colombia
-
 Congo
Congo
-
 Costa Rica
-
 Cote d'Ivoire
-
 Croatia
-
 Cuba
Cuba
-
 Cyprus
-
 Czechia
-
 DR Congo
-
 Denmark
-
 Dominican Republic
-
 Ecuador
-
 Egypt
Egypt
-
 El Salvador
-
 Estonia
-
 Eswatini
-
 Ethiopia
-
 Finland
-
 France
-
 Georgia
-
 Germany
-
 Ghana
Ghana
-
 Greece
-
 Haiti
Haiti
-
 Hong Kong
-
 Hungary
-
 India
India
-
 Indonesia
-
 Iran, Islamic republic
-
 Iraq
Iraq
-
 Ireland
-
 Israel
-
 Italy
Italy
-
 Jamaica
-
 Japan
Japan
-
 Jordan
-
 Kazakhstan
-
 Kenya
Kenya
-
 Korea
Korea
-
 Kuwait
-
 Kyrgyzstan
-
 Laos
Laos
-
 Latvia
-
 Lebanon
-
 Lesotho
-
 Libya
Libya
-
 Lithuania
-
 Luxembourg
-
 Madagascar
-
 Malaysia
-
 Malta
Malta
-
 Mauritius
-
 Mexico
-
 Moldova
-
 Mongolia
-
 Montenegro
-
 Morocco
-
 Mozambique
-
 Myanmar
-
 Namibia
-
 Nepal
Nepal
-
 Netherlands
-
 New Zealand
-
 Nigeria
-
 North Macedonia
-
 Norway
-
 Oman
Oman
-
 Pakistan
-
 Palestine
-
 Panama
-
 Papua New Guinea
-
 Paraguay
-
 Peru
Peru
-
 Philippines
-
 Poland
-
 Portugal
-
 Puerto Rico
-
 Qatar
Qatar
-
 Reunion
-
 Romania
-
 Rwanda
-
 Saudi Arabia
-
 Serbia
-
 Singapore
-
 Slovakia
-
 Slovenia
-
 Somalia
-
 South Africa
-
 Spain
Spain
-
 Sri Lanka
-
 Sweden
-
 Switzerland
-
 Syria
Syria
-
 Taiwan
-
 Tajikistan
-
 Tanzania
-
 Thailand
-
 Trinidad and Tobago
-
 Tunisia
-
 Turkey
-
 UAE
UAE
-
 Uganda
-
 Ukraine
-
 United Kingdom
-
United States
-
 Uruguay
-
 Uzbekistan
-
 Venezuela
-
 Vietnam
-
 Yemen
Yemen
-
 Zambia
-
 Zimbabwe
- Forex
- Crypto
