
Sonic declines as the price stays well under its long-term average

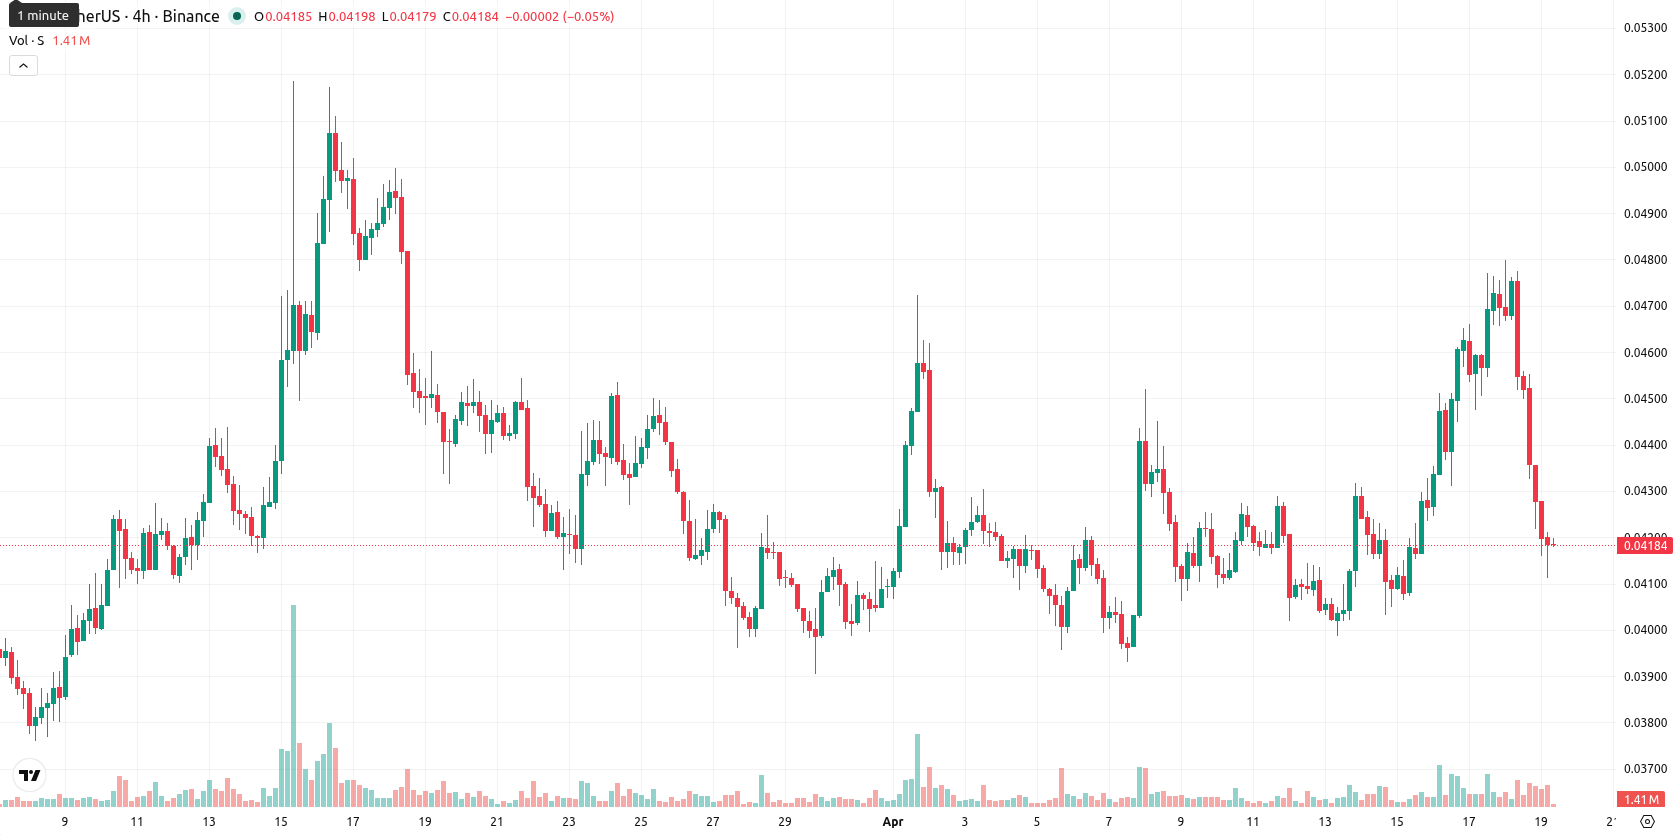
Sonic (S, formerly Fantom (FTM)) is trading at $0.0419 after a daily drop of 10.71%, keeping it just below its SMA-20 and SMA-50 at $0.0424. This shows ongoing seller pressure in the short- and medium-term, while the SMA-200 at $0.0926 signals a continued bearish long-term trend.
Highlights
- Sonic trades below major moving averages, signaling persistent selling pressure and a bearish long-term trend.
- Mixed momentum indicators reflect diverging signals, but price action and elevated volatility favor continued weakness.
- Near-term expected range is $0.0415 to $0.0447, with probability of upside below 20% and further declines likely if $0.0415 fails.
Mixed technical momentum as key resistance contains recovery
Technically, S remains under pressure with resistance from short- and medium-term moving averages and the Ichimoku Kijun at $0.0435. Momentum signals are mixed: MACD on D1 shows a weak buy, ADX is neutral at low levels, RSI is modestly bullish at 50, Stoch RSI indicates a strong sell, and CCI is overbought. BBP on D1 gives a mild buyer advantage, but with today’s price near its low, high volatility, and divergence across oscillators and momentum indicators, underlying weakness persists.
Downside favored as breakout triggers remain unlikely
Over the next five sessions, the typical volatility band is expected to be between $0.0415 and $0.0447. The likelihood of an upward move is very low (less than 20%), so further decline is the more probable scenario. Baseline scenario: the price stays in a narrow sideways range near current levels. A close above $0.0435 could open a short-term move toward $0.0447 resistance, while a break below $0.0415 would likely lead to accelerated declines.
Earlier, analysts noted that Sonic remained under persistent selling pressure, lacking clear bullish momentum. The current outlook reinforces this with ongoing weakness in both price action and indicators, making a decisive close above resistance or below support the key trigger for the next directional move.


Latest Sonic News


-
 Afghanistan
-
 Albania
-
 Algeria
-
 Angola
-
 Argentina
-
 Armenia
-
 Australia
-
 Austria
-
 Azerbaijan
-
 Bahamas
-
 Bahrain
-
 Bangladesh
-
 Belarus
-
 Belgium
-
 Bolivia
-
 Botswana
-
 Brazil
-
 Brunei
-
 Bulgaria
-
 Cambodia
-
 Cameroon
-
 Canada
-
 Chile
Chile
-
 China
China
-
 Colombia
-
 Congo
Congo
-
 Costa Rica
-
 Cote d'Ivoire
-
 Croatia
-
 Cuba
Cuba
-
 Cyprus
-
 Czechia
-
 DR Congo
-
 Denmark
-
 Dominican Republic
-
 Ecuador
-
 Egypt
Egypt
-
 El Salvador
-
 Estonia
-
 Eswatini
-
 Ethiopia
-
 Finland
-
 France
-
 Georgia
-
 Germany
-
 Ghana
Ghana
-
 Greece
-
 Haiti
Haiti
-
 Hong Kong
-
 Hungary
-
 India
India
-
 Indonesia
-
 Iran, Islamic republic
-
 Iraq
Iraq
-
 Ireland
-
 Israel
-
 Italy
Italy
-
 Jamaica
-
 Japan
Japan
-
 Jordan
-
 Kazakhstan
-
 Kenya
Kenya
-
 Korea
Korea
-
 Kuwait
-
 Kyrgyzstan
-
 Laos
Laos
-
 Latvia
-
 Lebanon
-
 Lesotho
-
 Libya
Libya
-
 Lithuania
-
 Luxembourg
-
 Madagascar
-
 Malaysia
-
 Malta
Malta
-
 Mauritius
-
 Mexico
-
 Moldova
-
 Mongolia
-
 Montenegro
-
 Morocco
-
 Mozambique
-
 Myanmar
-
 Namibia
-
 Nepal
Nepal
-
 Netherlands
-
 New Zealand
-
 Nigeria
-
 North Macedonia
-
 Norway
-
 Oman
Oman
-
 Pakistan
-
 Palestine
-
 Panama
-
 Papua New Guinea
-
 Paraguay
-
 Peru
Peru
-
 Philippines
-
 Poland
-
 Portugal
-
 Puerto Rico
-
 Qatar
Qatar
-
 Reunion
-
 Romania
-
 Rwanda
-
 Saudi Arabia
-
 Serbia
-
 Singapore
-
 Slovakia
-
 Slovenia
-
 Somalia
-
 South Africa
-
 Spain
Spain
-
 Sri Lanka
-
 Sweden
-
 Switzerland
-
 Syria
Syria
-
 Taiwan
-
 Tajikistan
-
 Tanzania
-
 Thailand
-
 Trinidad and Tobago
-
 Tunisia
-
 Turkey
-
 UAE
UAE
-
 Uganda
-
 Ukraine
-
 United Kingdom
-
United States
-
 Uruguay
-
 Uzbekistan
-
 Venezuela
-
 Vietnam
-
 Yemen
Yemen
-
 Zambia
-
 Zimbabwe
- Forex
- Crypto
