
Solana price prediction: Will $91.00 support hold as SOL trades flat?

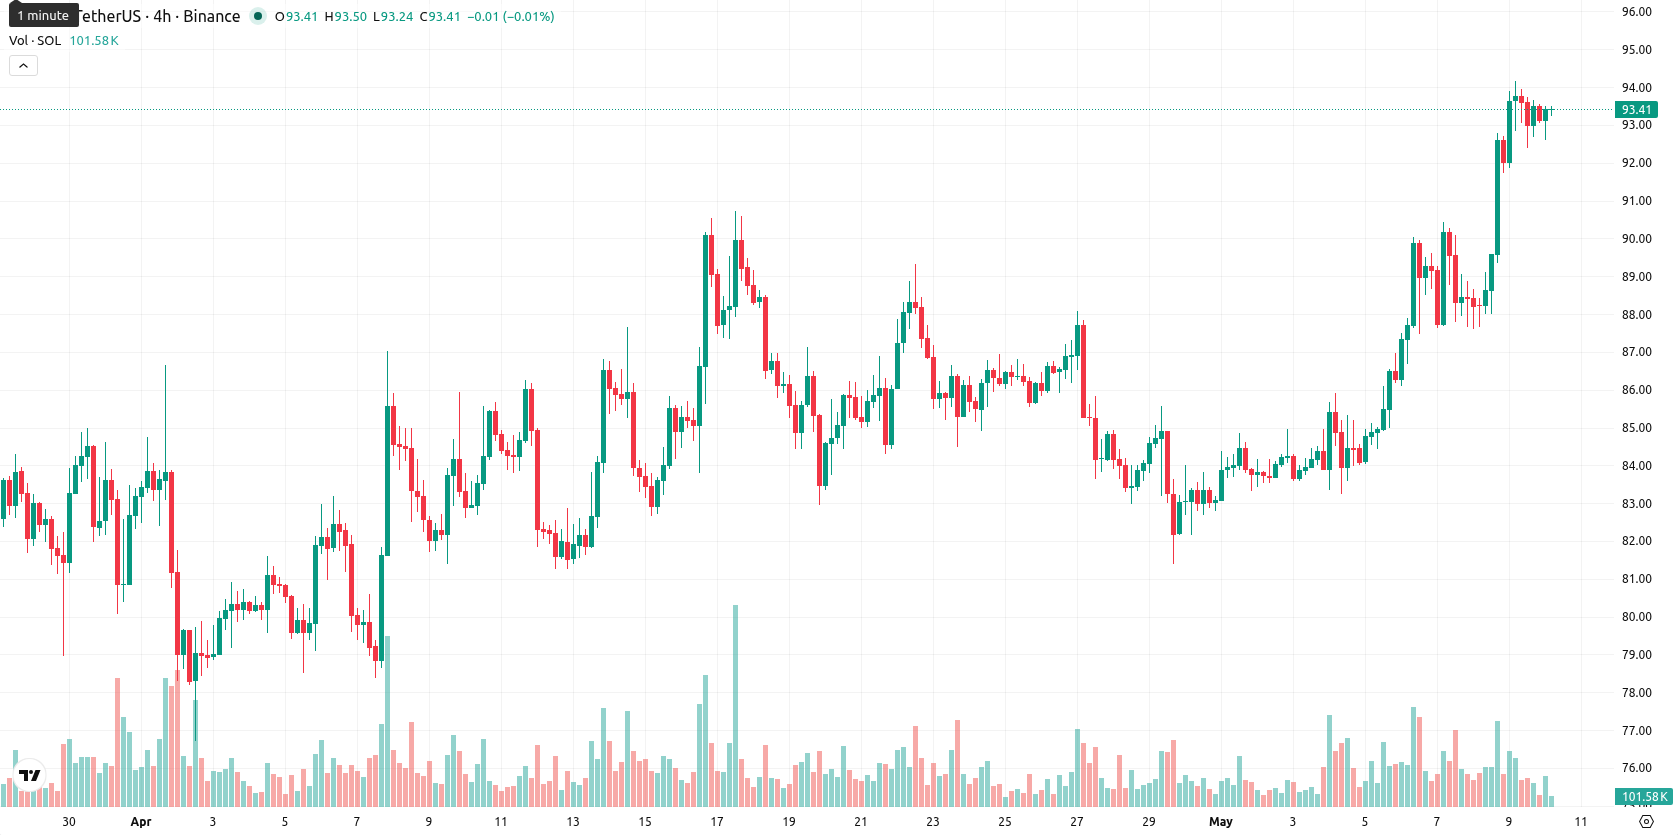
Solana (SOL) is trading at $93.33, marking a daily decline of 0.67%. The asset remains above its key short- and medium-term moving averages but below broader-term benchmarks.
Highlights
- Spot Solana ETF products saw $33 million in weekly inflows, signaling robust institutional demand and increased liquidity for SOL.
- A dormant whale account acquired 67,648 SOL valued at $6.23 million, bringing concentrated net buying pressure to the market.
- SOL trades within a $91.00–$96.00 range amid bullish short-term signals but faces broad selling pressure and risk of near-term pullback.
Institutional inflows and whale accumulation drive short-term liquidity despite selling
Spot Solana ETF products recorded $33 million in weekly inflows, including $6.7 million in a single session, reflecting a substantial allocation of capital to SOL investment vehicles and directly increasing liquidity tied to the asset. A previously dormant whale wallet purchased 67,648 SOL, totaling $6.23 million, introducing significant net demand in a concentrated period. Institutional flows and renewed focus on Solana’s settlement infrastructure have been observed amid greater stablecoin activity, though price action has remained under broader selling pressure.
Mixed momentum and overbought signals heighten short-term reversal risk
The SMA-20 at $86.18 and SMA-50 at $85.18 serve as immediate support levels beneath the current price, while the SMA-200 at $114.37 acts as the next major resistance to the upside. The Ichimoku Kijun is positioned at $87.73, adding to the support cluster. The D1 MACD issues a buy signal, but the ADX reading is neutral, indicating upward momentum without strong trend confirmation. Oscillators show stretched conditions, with the RSI at 67.80, CCI at 248.39, and Stoch RSI at 100, all highlighting overbought territory. The Bull/Bear Power (BBP) is strongly positive at 6.44, and the Awesome Oscillator supports bullish intraday dynamics, though mixed momentum and rising overbought signals suggest growing risk of near-term mean reversion.
Range-bound consolidation likely as upward breakout probability remains low
Over the next five trading days, SOL is expected to fluctuate within the $91.00–$96.00 range, which reflects typical volatility based on recent weekly patterns. The probability of a further upward breakout is low, as key weekly indicators continue to point downward. The baseline scenario is for continued consolidation within this band. Should SOL decisively breach $96.00, renewed buying may target higher resistance levels, while a break below $91.00 would expose deeper supports and risks a stronger downward move given the weak broader momentum.
Earlier, analysts noted that Solana was expected to retain a volatile, range-bound profile as regulatory clarity and robust intraday demand contended with lingering resistance and elevated risk. The latest surge in institutional inflows and whale accumulation bolsters this thesis, but with overbought signals intensifying and broader selling pressure in play, traders should now focus on the $91.00–$96.00 volatility band as the next decisive zone for Solana’s near-term direction.


Latest Solana News


-
 Afghanistan
-
 Albania
-
 Algeria
-
 Angola
-
 Argentina
-
 Armenia
-
 Australia
-
 Austria
-
 Azerbaijan
-
 Bahamas
-
 Bahrain
-
 Bangladesh
-
 Belarus
-
 Belgium
-
 Bolivia
-
 Botswana
-
 Brazil
-
 Brunei
-
 Bulgaria
-
 Cambodia
-
 Cameroon
-
 Canada
-
 Chile
Chile
-
 China
China
-
 Colombia
-
 Congo
Congo
-
 Costa Rica
-
 Cote d'Ivoire
-
 Croatia
-
 Cuba
Cuba
-
 Cyprus
-
 Czechia
-
 DR Congo
-
 Denmark
-
 Dominican Republic
-
 Ecuador
-
 Egypt
Egypt
-
 El Salvador
-
 Estonia
-
 Eswatini
-
 Ethiopia
-
 Finland
-
 France
-
 Georgia
-
 Germany
-
 Ghana
Ghana
-
 Greece
-
 Haiti
Haiti
-
 Hong Kong
-
 Hungary
-
 India
India
-
 Indonesia
-
 Iran, Islamic republic
-
 Iraq
Iraq
-
 Ireland
-
 Israel
-
 Italy
Italy
-
 Jamaica
-
 Japan
Japan
-
 Jordan
-
 Kazakhstan
-
 Kenya
Kenya
-
 Korea
Korea
-
 Kuwait
-
 Kyrgyzstan
-
 Laos
Laos
-
 Latvia
-
 Lebanon
-
 Lesotho
-
 Libya
Libya
-
 Lithuania
-
 Luxembourg
-
 Madagascar
-
 Malaysia
-
 Malta
Malta
-
 Mauritius
-
 Mexico
-
 Moldova
-
 Mongolia
-
 Montenegro
-
 Morocco
-
 Mozambique
-
 Myanmar
-
 Namibia
-
 Nepal
Nepal
-
 Netherlands
-
 New Zealand
-
 Nigeria
-
 North Macedonia
-
 Norway
-
 Oman
Oman
-
 Pakistan
-
 Palestine
-
 Panama
-
 Papua New Guinea
-
 Paraguay
-
 Peru
Peru
-
 Philippines
-
 Poland
-
 Portugal
-
 Puerto Rico
-
 Qatar
Qatar
-
 Reunion
-
 Romania
-
 Rwanda
-
 Saudi Arabia
-
 Serbia
-
 Singapore
-
 Slovakia
-
 Slovenia
-
 Somalia
-
 South Africa
-
 Spain
Spain
-
 Sri Lanka
-
 Sweden
-
 Switzerland
-
 Syria
Syria
-
 Taiwan
-
 Tajikistan
-
 Tanzania
-
 Thailand
-
 Trinidad and Tobago
-
 Tunisia
-
 Turkey
-
 UAE
UAE
-
 Uganda
-
 Ukraine
-
 United Kingdom
-
United States
-
 Uruguay
-
 Uzbekistan
-
 Venezuela
-
 Vietnam
-
 Yemen
Yemen
-
 Zambia
-
 Zimbabwe
- Forex
- Crypto
