
Intraday selling pressure pushes Sonic below key levels

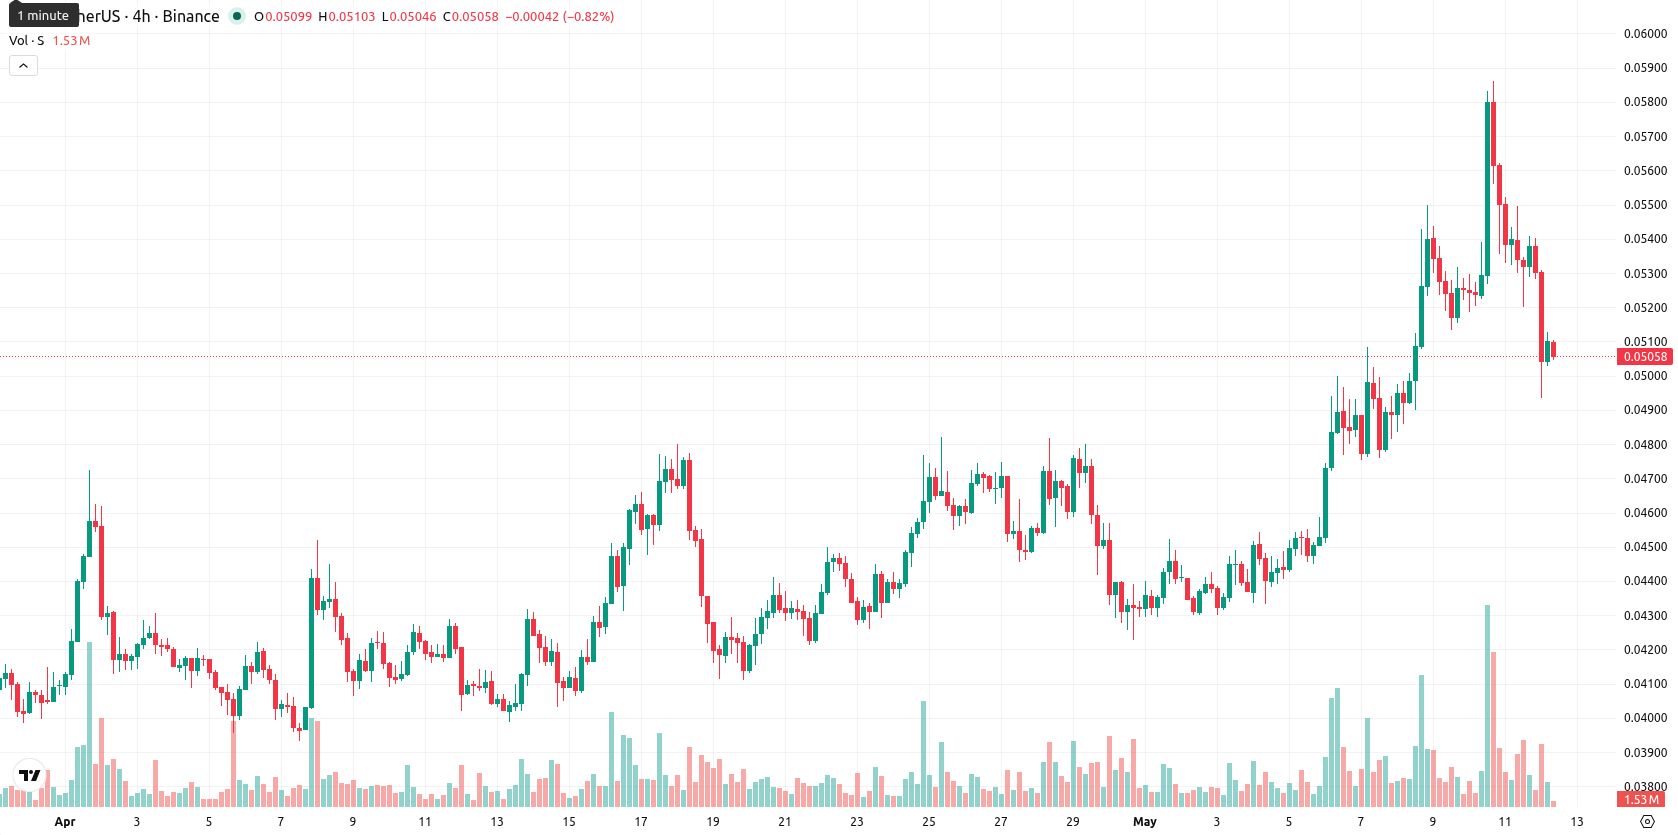
Sonic (S) is trading at $0.0506, down 7.09% on the day. The price remains above its key short- and medium-term moving averages, but daily performance has been marked by high volatility and a move toward session lows.
Highlights
- Sonic maintains a short- and medium-term bullish bias, but long-term trends indicate persistent downward pressure.
- Mixed momentum signals and high volatility point to caution, as daily performance turned negative despite underlying optimism.
- Expect Sonic to trade between $0.0490 and $0.0535 over the next five days, with downside risk dominating short-term outlook.
Bullish momentum persists as mixed signals and selling pressure collide
The current price of $0.0506 sits above the SMA-20 at $0.0470 and the SMA-50 at $0.0442, while trending well below the SMA-200 at $0.0727. The Ichimoku Kijun level at $0.0499 acts as immediate support. On the daily chart, MACD and ADX confirm bullish momentum, but oscillators are mixed: RSI remains in buy territory, CCI signals overbought conditions, and Stoch RSI points to strong selling activity. Bull/Bear Power (BBP) is marginally positive, indicating modest buyer presence, while the Awesome Oscillator backs a bullish technical bias. The price closing near today's low and encountering high volatility demonstrates notable intraday selling pressure, even as overall momentum measures remain constructive.
Sideways pattern expected as volatility bands limit upside potential
Over the next five trading days, S is likely to fluctuate within a volatility band defined by $0.0490 and $0.0535, corresponding to a typical range of roughly ±10% from current levels. The probability of further gains is low, with less than a 20% chance based on weekly momentum and trend indicators that suggest downside risk. The baseline scenario is for the price to remain in a sideways corridor as volatility moderates. A close above resistance at $0.0499 would support a move toward the upper end of the range, while a decisive break below $0.0490 could expose the asset to further declines.
Earlier, analysts noted that Sonic was exhibiting robust short-term bullish momentum, though longer-term resistance remained a challenge. The recent uptick in volatility and increased selling pressure now highlight the importance of monitoring whether the $0.0499 support can hold, as a sustained break below this level could trigger a deeper correction.


Latest Sonic News


-
 Afghanistan
-
 Albania
-
 Algeria
-
 Angola
-
 Argentina
-
 Armenia
-
 Australia
-
 Austria
-
 Azerbaijan
-
 Bahamas
-
 Bahrain
-
 Bangladesh
-
 Belarus
-
 Belgium
-
 Bolivia
-
 Botswana
-
 Brazil
-
 Brunei
-
 Bulgaria
-
 Cambodia
-
 Cameroon
-
 Canada
-
 Chile
Chile
-
 China
China
-
 Colombia
-
 Congo
Congo
-
 Costa Rica
-
 Cote d'Ivoire
-
 Croatia
-
 Cuba
Cuba
-
 Cyprus
-
 Czechia
-
 DR Congo
-
 Denmark
-
 Dominican Republic
-
 Ecuador
-
 Egypt
Egypt
-
 El Salvador
-
 Estonia
-
 Eswatini
-
 Ethiopia
-
 Finland
-
 France
-
 Georgia
-
 Germany
-
 Ghana
Ghana
-
 Greece
-
 Haiti
Haiti
-
 Hong Kong
-
 Hungary
-
 India
India
-
 Indonesia
-
 Iran, Islamic republic
-
 Iraq
Iraq
-
 Ireland
-
 Israel
-
 Italy
Italy
-
 Jamaica
-
 Japan
Japan
-
 Jordan
-
 Kazakhstan
-
 Kenya
Kenya
-
 Korea
Korea
-
 Kuwait
-
 Kyrgyzstan
-
 Laos
Laos
-
 Latvia
-
 Lebanon
-
 Lesotho
-
 Libya
Libya
-
 Lithuania
-
 Luxembourg
-
 Madagascar
-
 Malaysia
-
 Malta
Malta
-
 Mauritius
-
 Mexico
-
 Moldova
-
 Mongolia
-
 Montenegro
-
 Morocco
-
 Mozambique
-
 Myanmar
-
 Namibia
-
 Nepal
Nepal
-
 Netherlands
-
 New Zealand
-
 Nigeria
-
 North Macedonia
-
 Norway
-
 Oman
Oman
-
 Pakistan
-
 Palestine
-
 Panama
-
 Papua New Guinea
-
 Paraguay
-
 Peru
Peru
-
 Philippines
-
 Poland
-
 Portugal
-
 Puerto Rico
-
 Qatar
Qatar
-
 Reunion
-
 Romania
-
 Rwanda
-
 Saudi Arabia
-
 Serbia
-
 Singapore
-
 Slovakia
-
 Slovenia
-
 Somalia
-
 South Africa
-
 Spain
Spain
-
 Sri Lanka
-
 Sweden
-
 Switzerland
-
 Syria
Syria
-
 Taiwan
-
 Tajikistan
-
 Tanzania
-
 Thailand
-
 Trinidad and Tobago
-
 Tunisia
-
 Turkey
-
 UAE
UAE
-
 Uganda
-
 Ukraine
-
 United Kingdom
-
United States
-
 Uruguay
-
 Uzbekistan
-
 Venezuela
-
 Vietnam
-
 Yemen
Yemen
-
 Zambia
-
 Zimbabwe
- Forex
- Crypto
