

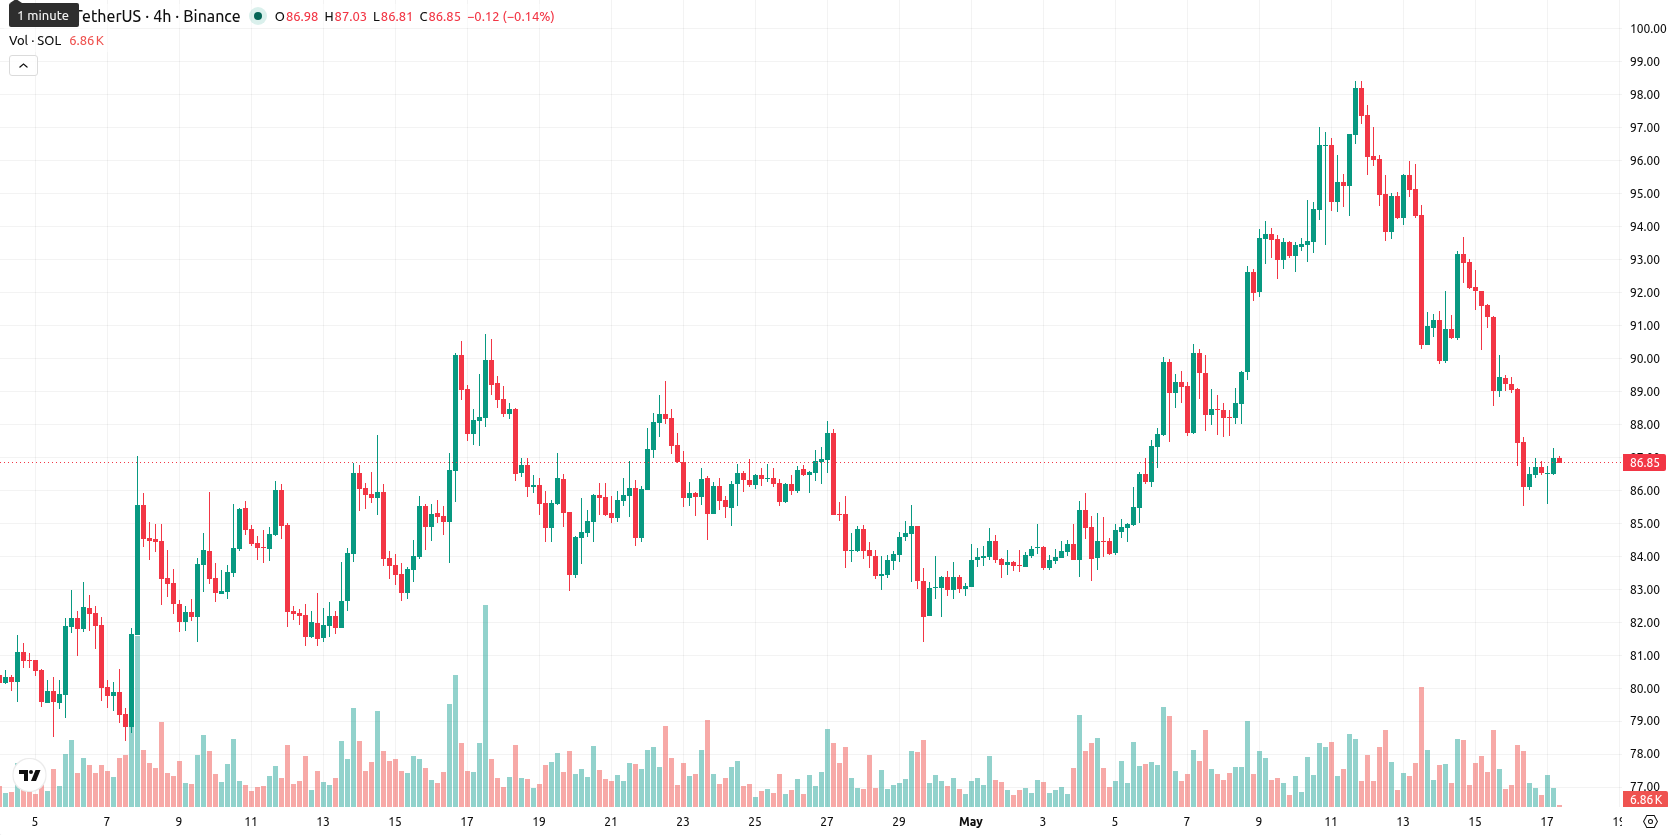
Solana (SOL) is trading at $86.94, posting a daily decline of 0.56%. The asset sits below its main short- and long-term moving averages, with price currently just above the intermediate trend line.
Highlights
- Kevin Warsh's appointment as Fed Chair with disclosed Solana holdings marks the first direct digital asset exposure at this level, signaling rising institutional legitimacy.
- The CLARITY Act progressing in the Senate and $58 million in ETF inflows highlight stronger regulatory momentum and increased Solana adoption, driving assets under management past $1.05 billion.
- Solana trades under key trend averages with most technical indicators reflecting weak momentum and bearish sentiment; likely to consolidate between $85.00 and $90.00 over the next week.
Policy precedent and inflows drive access optimism amid regulatory risk
On May 15, Kevin Warsh formally assumed the position of Federal Reserve Chair with publicly disclosed holdings of Solana, marking the first time a central banker in this role has entered office with exposure to the asset. This sets a precedent at the highest policy level, raising expectations for regulatory changes that could increase digital asset accessibility and legitimacy. Additional regulatory movement followed as the CLARITY Act cleared the Senate Banking Committee, establishing new frameworks for digital assets including Solana, while spot Solana ETFs recorded $58 million in net inflows for the week, bringing total assets under management to over $1.05 billion. A surge in USDe and other stablecoin supplies on the network has also contributed to concentration risk, increasing the potential impact of regulatory or technical disruptions, though price action has remained under broader selling pressure.
Mixed momentum and oversold signals amid resistance and weak trend
The technical setup for SOL shows the price trading just above the SMA-50 at $85.78, yet remaining below the SMA-20 at $88.37 and well under the SMA-200 at $110.85. Immediate resistance is defined by the Ichimoku Kijun at $89.91. The current trading range is $85.65 to $87.20, suggesting moderate intraday volatility. Momentum signals are mixed: while the MACD on the daily chart gives a strong buy reading, the ADX remains low at 12.72, pointing to weak trend strength. Oscillators such as the Stoch RSI, now at 0.00, and a subdued RSI at 45.71 indicate oversold conditions, while BBP remains deeply negative, confirming persistent seller dominance in the intraday action.
Downside bias dominates as consolidation defines short-term outlook
Over the next five trading days, SOL is expected to consolidate within a typical volatility band of $85.00 to $90.00. Downside scenarios are more probable, with less than a 20% chance of a sustained increase in price, based on prevailing D1 and W1 indicator readings. Sideways price movement near current levels forms the base case. A clear break above $89.91 would be needed to initiate a bullish move, while a drop below $85.00 could trigger further declines.
Earlier, analysts noted that Solana was experiencing limited momentum and persistent selling pressure, reflecting a cautious outlook despite signs of growing institutional involvement. With the latest developments in regulatory policy and central bank exposure further spotlighting Solana's evolving risk profile, investors should closely monitor any break above the Ichimoku Kijun at $89.91 as a potential catalyst for renewed upside.


-
 Afghanistan
-
 Albania
-
 Algeria
-
 Angola
-
 Argentina
-
 Armenia
-
 Australia
-
 Austria
-
 Azerbaijan
-
 Bahamas
-
 Bahrain
-
 Bangladesh
-
 Belarus
-
 Belgium
-
 Bolivia
-
 Botswana
-
 Brazil
-
 Brunei
-
 Bulgaria
-
 Cambodia
-
 Cameroon
-
 Canada
-
 Chile
Chile
-
 China
China
-
 Colombia
-
 Congo
Congo
-
 Costa Rica
-
 Cote d'Ivoire
-
 Croatia
-
 Cuba
Cuba
-
 Cyprus
-
 Czechia
-
 DR Congo
-
 Denmark
-
 Dominican Republic
-
 Ecuador
-
 Egypt
Egypt
-
 El Salvador
-
 Estonia
-
 Eswatini
-
 Ethiopia
-
 Finland
-
 France
-
 Georgia
-
 Germany
-
 Ghana
Ghana
-
 Greece
-
 Haiti
Haiti
-
 Hong Kong
-
 Hungary
-
 India
India
-
 Indonesia
-
 Iran, Islamic republic
-
 Iraq
Iraq
-
 Ireland
-
 Israel
-
 Italy
Italy
-
 Jamaica
-
 Japan
Japan
-
 Jordan
-
 Kazakhstan
-
 Kenya
Kenya
-
 Korea
Korea
-
 Kuwait
-
 Kyrgyzstan
-
 Laos
Laos
-
 Latvia
-
 Lebanon
-
 Lesotho
-
 Libya
Libya
-
 Lithuania
-
 Luxembourg
-
 Madagascar
-
 Malaysia
-
 Malta
Malta
-
 Mauritius
-
 Mexico
-
 Moldova
-
 Mongolia
-
 Montenegro
-
 Morocco
-
 Mozambique
-
 Myanmar
-
 Namibia
-
 Nepal
Nepal
-
 Netherlands
-
 New Zealand
-
 Nigeria
-
 North Macedonia
-
 Norway
-
 Oman
Oman
-
 Pakistan
-
 Palestine
-
 Panama
-
 Papua New Guinea
-
 Paraguay
-
 Peru
Peru
-
 Philippines
-
 Poland
-
 Portugal
-
 Puerto Rico
-
 Qatar
Qatar
-
 Reunion
-
 Romania
-
 Rwanda
-
 Saudi Arabia
-
 Serbia
-
 Singapore
-
 Slovakia
-
 Slovenia
-
 Somalia
-
 South Africa
-
 Spain
Spain
-
 Sri Lanka
-
 Sweden
-
 Switzerland
-
 Syria
Syria
-
 Taiwan
-
 Tajikistan
-
 Tanzania
-
 Thailand
-
 Trinidad and Tobago
-
 Tunisia
-
 Turkey
-
 UAE
UAE
-
 Uganda
-
 Ukraine
-
 United Kingdom
-
United States
-
 Uruguay
-
 Uzbekistan
-
 Venezuela
-
 Vietnam
-
 Yemen
Yemen
-
 Zambia
-
 Zimbabwe
- Forex
- Crypto
