
+7.57% for The Graph as persistent momentum tests upper range

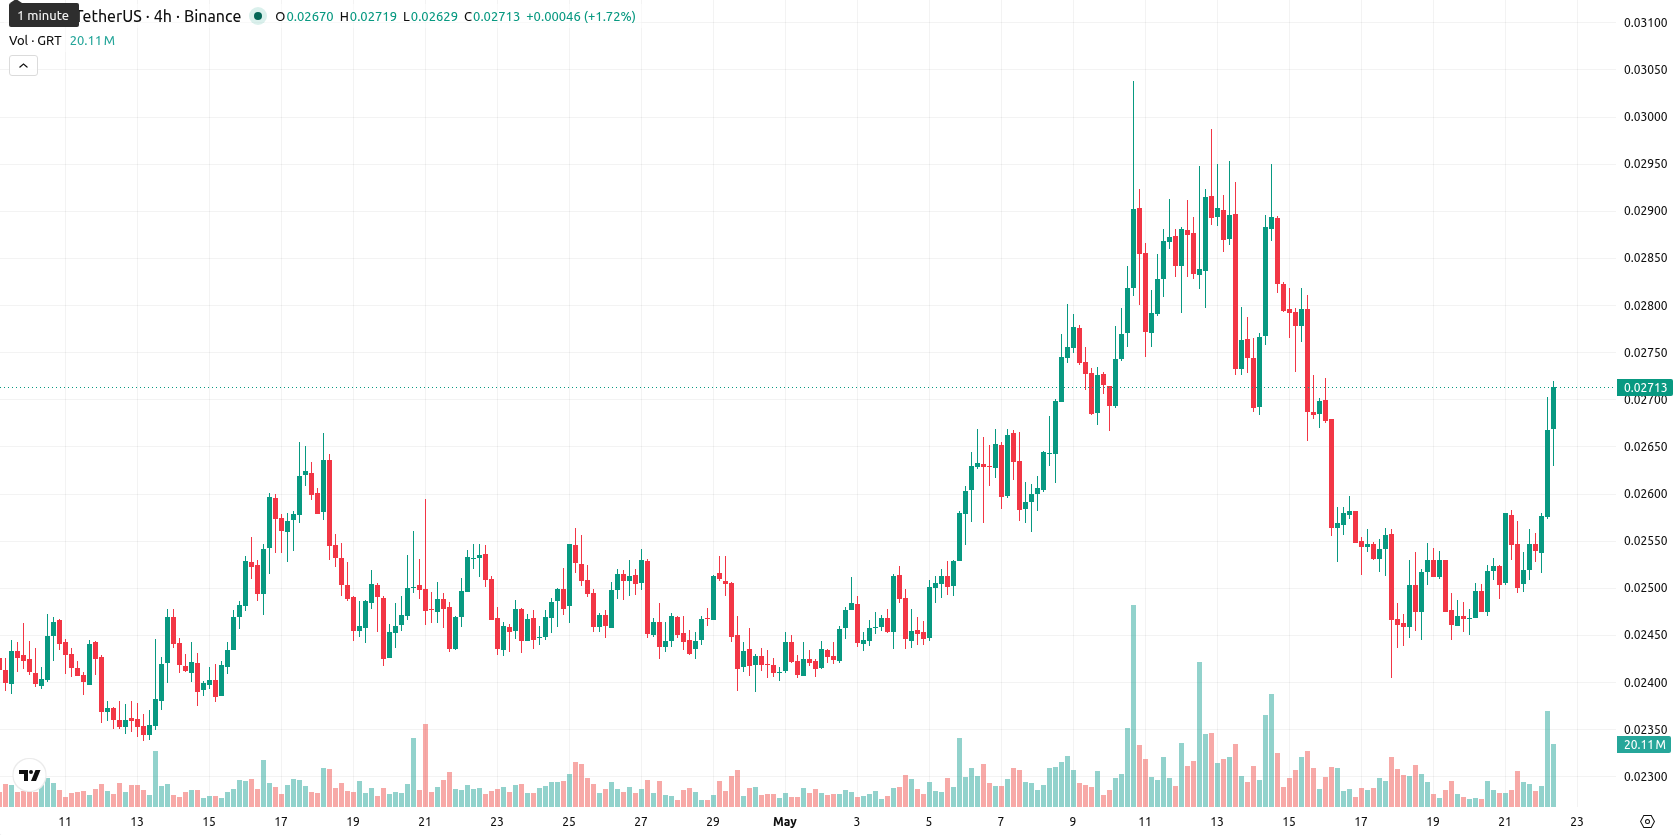
The Graph (GRT) is trading at $0.027334 after rising 7.57% over the last 24 hours. The price sits above its key short- and medium-term moving averages but remains under longer-term resistance.
Highlights
- GRT maintains a short- and medium-term bullish technical bias, trading above its 20- and 50-day averages but remains below the long-term trend.
- Momentum signals are mixed, with trend strength rising yet key oscillators indicate oversold or neutral conditions and buyer dominance intraday.
- Price is likely to remain in a narrow range between $0.02615 and $0.02770 over the next five days, with downside risk favored.
Mixed momentum amid support tests and resistance cap
On the technical front, GRT is trading above the D1 SMA-20 at $0.02628990 and SMA-50 at $0.02520876, but remains below the SMA-200 at $0.03441799. The Ichimoku Kijun on the daily chart stands at $0.027135, just beneath the current price, acting as immediate support. ADX on D1 signals a strengthening trend, while MACD remains neutral and RSI is bearish at 47.7. Momentum readings are mixed, with Stoch RSI indicating oversold conditions, CCI neutral, and BBP pointing to intraday buyer dominance. Today's session opened with a minor gap and trades close to the session high, showing moderate volatility and persistence of buyers, but oscillator divergence signals caution.
Downside risk rises as volatility bands define outlook
Over the next five trading days, GRT is expected to fluctuate in a volatility band from $0.02615 to $0.02770 relative to current levels. The likelihood of further price increases is low (under 20%), making a downward move more probable. Baseline expectations point to sideways trading near support, with a bullish scenario of breakout above $0.02770 leading to a test of short-term resistance, and a bearish scenario in which failure at $0.02615 triggers further losses according to weak weekly momentum and higher timeframe moving averages.
Earlier, analysts noted that The Graph remained under sustained bearish pressure and faced challenges in reversing its downward trend. While momentum remains mixed, the current technical setup warrants close monitoring of the potential for a downside break if support at $0.02615 fails in the coming sessions.


-
 Afghanistan
-
 Albania
-
 Algeria
-
 Angola
-
 Argentina
-
 Armenia
-
 Australia
-
 Austria
-
 Azerbaijan
-
 Bahamas
-
 Bahrain
-
 Bangladesh
-
 Belarus
-
 Belgium
-
 Bolivia
-
 Botswana
-
 Brazil
-
 Brunei
-
 Bulgaria
-
 Cambodia
-
 Cameroon
-
 Canada
-
 Chile
Chile
-
 China
China
-
 Colombia
-
 Congo
Congo
-
 Costa Rica
-
 Cote d'Ivoire
-
 Croatia
-
 Cuba
Cuba
-
 Cyprus
-
 Czechia
-
 DR Congo
-
 Denmark
-
 Dominican Republic
-
 Ecuador
-
 Egypt
Egypt
-
 El Salvador
-
 Estonia
-
 Eswatini
-
 Ethiopia
-
 Finland
-
 France
-
 Georgia
-
 Germany
-
 Ghana
Ghana
-
 Greece
-
 Haiti
Haiti
-
 Hong Kong
-
 Hungary
-
 India
India
-
 Indonesia
-
 Iran, Islamic republic
-
 Iraq
Iraq
-
 Ireland
-
 Israel
-
 Italy
Italy
-
 Jamaica
-
 Japan
Japan
-
 Jordan
-
 Kazakhstan
-
 Kenya
Kenya
-
 Korea
Korea
-
 Kuwait
-
 Kyrgyzstan
-
 Laos
Laos
-
 Latvia
-
 Lebanon
-
 Lesotho
-
 Libya
Libya
-
 Lithuania
-
 Luxembourg
-
 Madagascar
-
 Malaysia
-
 Malta
Malta
-
 Mauritius
-
 Mexico
-
 Moldova
-
 Mongolia
-
 Montenegro
-
 Morocco
-
 Mozambique
-
 Myanmar
-
 Namibia
-
 Nepal
Nepal
-
 Netherlands
-
 New Zealand
-
 Nigeria
-
 North Macedonia
-
 Norway
-
 Oman
Oman
-
 Pakistan
-
 Palestine
-
 Panama
-
 Papua New Guinea
-
 Paraguay
-
 Peru
Peru
-
 Philippines
-
 Poland
-
 Portugal
-
 Puerto Rico
-
 Qatar
Qatar
-
 Reunion
-
 Romania
-
 Rwanda
-
 Saudi Arabia
-
 Serbia
-
 Singapore
-
 Slovakia
-
 Slovenia
-
 Somalia
-
 South Africa
-
 Spain
Spain
-
 Sri Lanka
-
 Sweden
-
 Switzerland
-
 Syria
Syria
-
 Taiwan
-
 Tajikistan
-
 Tanzania
-
 Thailand
-
 Trinidad and Tobago
-
 Tunisia
-
 Turkey
-
 UAE
UAE
-
 Uganda
-
 Ukraine
-
 United Kingdom
-
United States
-
 Uruguay
-
 Uzbekistan
-
 Venezuela
-
 Vietnam
-
 Yemen
Yemen
-
 Zambia
-
 Zimbabwe
- Forex
- Crypto
