
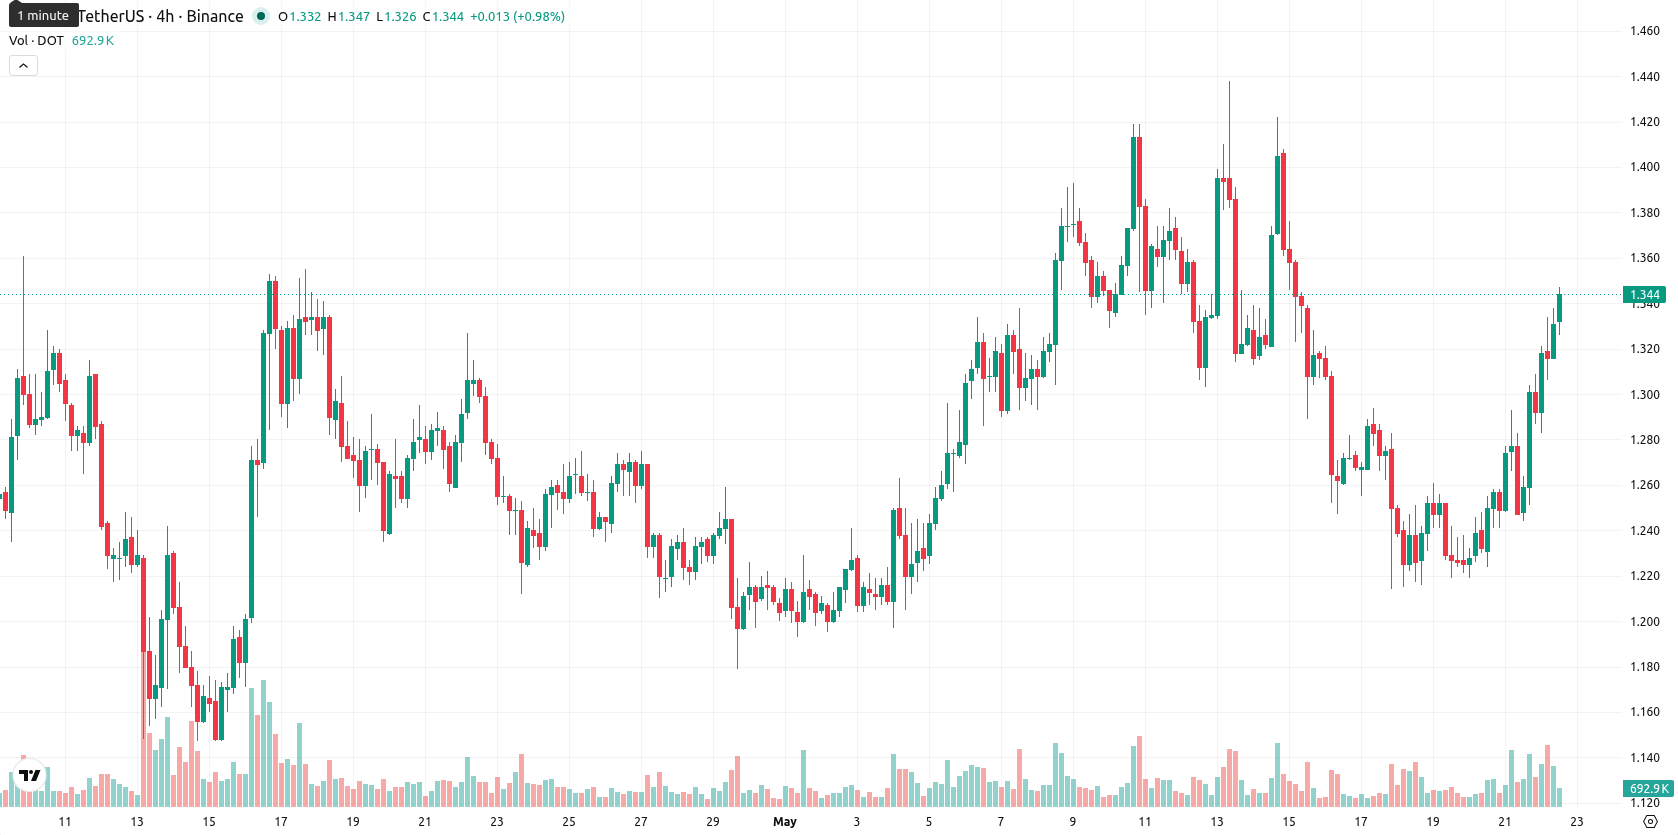
Polkadot moves higher amid session volatility approaching $1.40 resistance

Polkadot (DOT) is trading at $1.343, up 7.01% for the day. The price currently sits above its key short- and medium-term moving averages, suggesting positive momentum at these timeframes.
Highlights
- DOT shows short- and medium-term upside momentum but remains under overall bearish long-term trend pressure.
- Momentum indicators are mixed, with oscillators diverging, ADX signaling a weak trend, and intraday volatility elevated amid strong early buying.
- DOT is projected to trade in a $1.31–$1.40 range over the next five days, with further upside considered unlikely and downside risk prevailing if support fails.
Mixed bullish signals as daily momentum meets resistance
On the technical front, DOT is trading above the MA-20 ($1.296) and MA-50 ($1.270) but remains well below the MA-200 ($1.731). The Ichimoku Kijun level at $1.309 serves as immediate support beneath the current price. Momentum indicators are mixed: the MACD on the daily chart is neutral, ADX is weak at 14, and RSI prints a modestly positive 50.5. Stoch RSI and CCI are neutral on the daily but overbought on lower timeframes, while BBP on D1 indicates buyer dominance. The Awesome Oscillator remains negative, partially contradicting intraday bullish momentum, as the price approaches session highs within a volatile $1.283–$1.347 range.
Range-bound outlook as upside risk faces technical barriers
Looking ahead, the typical volatility band for DOT over the next five trading days is expected to be between $1.31 and $1.40. The probability of a further upward breakout is low—less than 20%—making a consolidation or mild pullback more likely. The base case scenario sees DOT trading sideways in this range as shorter-term momentum meets resistance from longer-term technical barriers. A move above $1.40 could trigger a bullish extension, while a drop below $1.31 would expose the asset to retesting recent local lows.
Earlier, analysts noted that Polkadot was experiencing sustained bearish momentum with limited prospects for a near-term breakout. The latest shift to short-term bullishness, as DOT trades above key moving averages, signals a potential change in trend, but traders should watch for a decisive move above $1.40 to confirm further upside or a drop below $1.31 as a renewed downside risk.


Latest Polkadot News


-
 Afghanistan
-
 Albania
-
 Algeria
-
 Angola
-
 Argentina
-
 Armenia
-
 Australia
-
 Austria
-
 Azerbaijan
-
 Bahamas
-
 Bahrain
-
 Bangladesh
-
 Belarus
-
 Belgium
-
 Bolivia
-
 Botswana
-
 Brazil
-
 Brunei
-
 Bulgaria
-
 Cambodia
-
 Cameroon
-
 Canada
-
 Chile
Chile
-
 China
China
-
 Colombia
-
 Congo
Congo
-
 Costa Rica
-
 Cote d'Ivoire
-
 Croatia
-
 Cuba
Cuba
-
 Cyprus
-
 Czechia
-
 DR Congo
-
 Denmark
-
 Dominican Republic
-
 Ecuador
-
 Egypt
Egypt
-
 El Salvador
-
 Estonia
-
 Eswatini
-
 Ethiopia
-
 Finland
-
 France
-
 Georgia
-
 Germany
-
 Ghana
Ghana
-
 Greece
-
 Haiti
Haiti
-
 Hong Kong
-
 Hungary
-
 India
India
-
 Indonesia
-
 Iran, Islamic republic
-
 Iraq
Iraq
-
 Ireland
-
 Israel
-
 Italy
Italy
-
 Jamaica
-
 Japan
Japan
-
 Jordan
-
 Kazakhstan
-
 Kenya
Kenya
-
 Korea
Korea
-
 Kuwait
-
 Kyrgyzstan
-
 Laos
Laos
-
 Latvia
-
 Lebanon
-
 Lesotho
-
 Libya
Libya
-
 Lithuania
-
 Luxembourg
-
 Madagascar
-
 Malaysia
-
 Malta
Malta
-
 Mauritius
-
 Mexico
-
 Moldova
-
 Mongolia
-
 Montenegro
-
 Morocco
-
 Mozambique
-
 Myanmar
-
 Namibia
-
 Nepal
Nepal
-
 Netherlands
-
 New Zealand
-
 Nigeria
-
 North Macedonia
-
 Norway
-
 Oman
Oman
-
 Pakistan
-
 Palestine
-
 Panama
-
 Papua New Guinea
-
 Paraguay
-
 Peru
Peru
-
 Philippines
-
 Poland
-
 Portugal
-
 Puerto Rico
-
 Qatar
Qatar
-
 Reunion
-
 Romania
-
 Rwanda
-
 Saudi Arabia
-
 Serbia
-
 Singapore
-
 Slovakia
-
 Slovenia
-
 Somalia
-
 South Africa
-
 Spain
Spain
-
 Sri Lanka
-
 Sweden
-
 Switzerland
-
 Syria
Syria
-
 Taiwan
-
 Tajikistan
-
 Tanzania
-
 Thailand
-
 Trinidad and Tobago
-
 Tunisia
-
 Turkey
-
 UAE
UAE
-
 Uganda
-
 Ukraine
-
 United Kingdom
-
United States
-
 Uruguay
-
 Uzbekistan
-
 Venezuela
-
 Vietnam
-
 Yemen
Yemen
-
 Zambia
-
 Zimbabwe
- Forex
- Crypto
