
Bitcoin price prediction: $75,680 support in focus as BTC sheds 1.55%

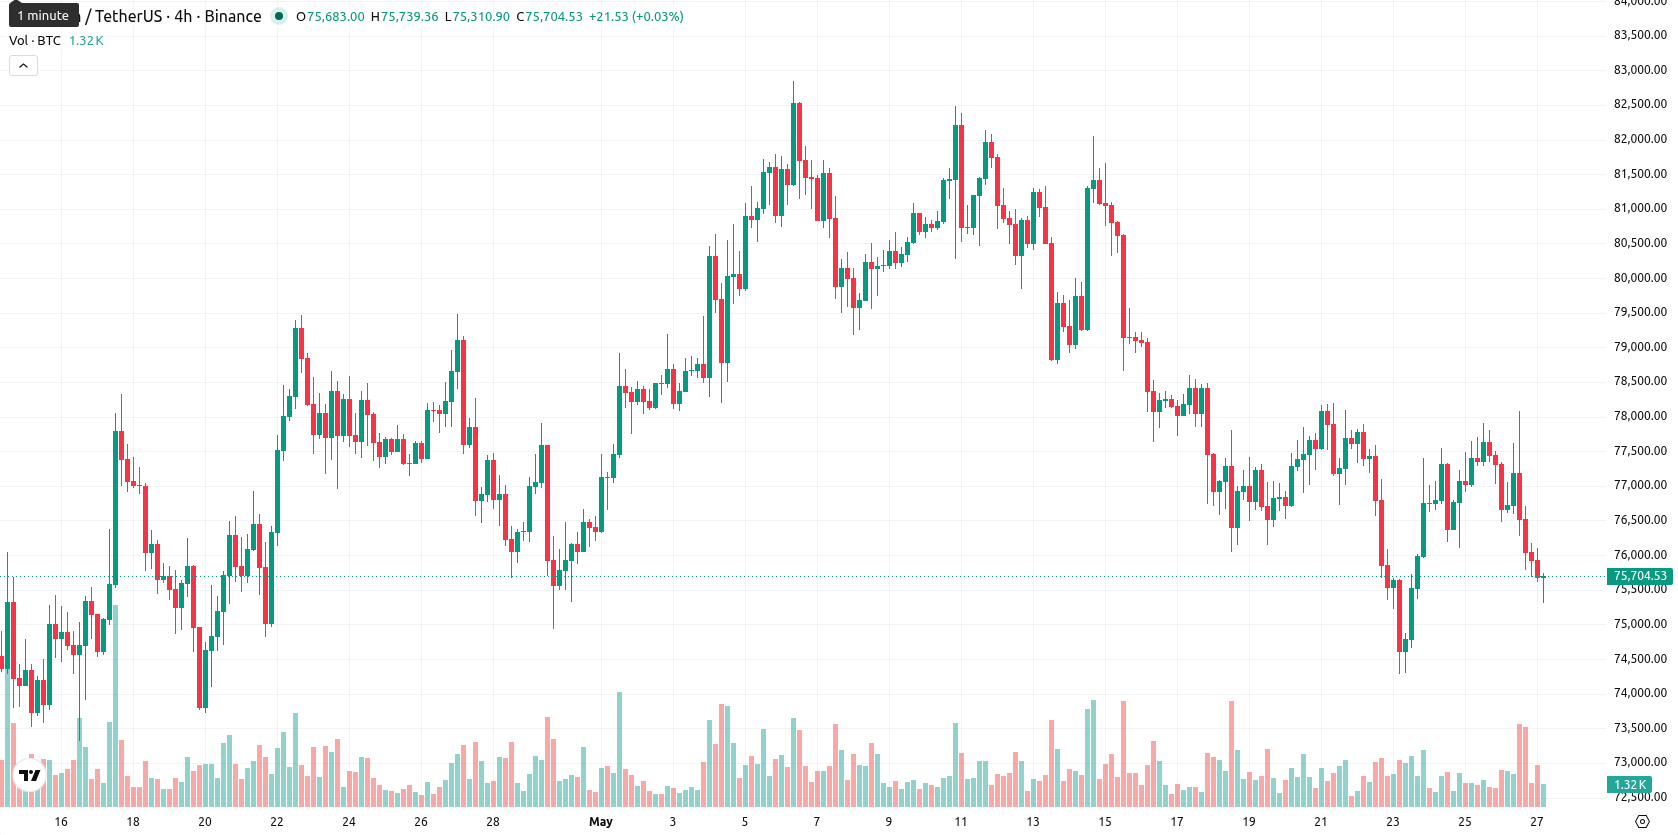
Bitcoin (BTC) is trading at $75,736, with a daily decline of 1.55%. The price is currently situated below its key moving averages, reflecting prevailing downside pressure in the short, medium, and long-term trends.
Highlights
- U.S. military actions near the Strait of Hormuz caused $300 million in crypto liquidations, triggering forced selling and reduced liquidity.
- Over $2 billion has exited U.S. spot Bitcoin ETFs since May 7, with BlackRock's IBIT alone seeing a $1.3 billion one-day outflow.
- Bitcoin trades below major moving averages with persistent bearish momentum; price is expected to consolidate within a $75,680–$76,880 range next week.
ETF outflows accelerate as forced liquidations and volatility decline
U.S. strikes on Iranian vessels near the Strait of Hormuz on May 26, 2026 led to approximately $300 million in crypto liquidations, causing a sudden wave of forced selling and a decrease in overall market liquidity. Continuing institutional outflows from U.S. spot Bitcoin ETFs have resulted in over $2 billion exiting these vehicles since May 7, 2026, with BlackRock's IBIT alone recording a $1.3 billion single-day sale, reflecting significant withdrawals by major holders. Market data shows that Bitcoin's implied volatility dropped to a nine-month low during May amid these ETF outflows and reduced investor demand, illustrating diminished engagement by speculative and long-term participants.
Soft momentum persists as BTC tests oversold boundaries near session low
BTC trades below the MA-20 ($78,602.94), MA-50 ($77,090.81), and MA-200 ($80,301.74), with the Ichimoku Kijun setting immediate resistance at $78,569.80. Oscillator analysis shows the MACD and ADX are both weak, indicating only soft downside momentum. RSI, CCI, and Stoch RSI all flag conditions that are moving towards or within oversold zones, while BBP confirms buyers have lost short-term control. The current range for the session is $75,312.99 to $76,104.02, with price action concentrated toward the lower end and the Awesome Oscillator supporting the continuation of prevailing downside momentum. There is no signal of divergence between price and momentum from any of the indicators.
Rangebound outlook solidifies as support tests heighten downside risk
Over the next week, BTC is expected to consolidate within a range of $75,680 to $76,880, representing a volatility band relative to current levels. Based on the direction of key weekly indicators, the probability of a meaningful price increase is less than 20%. The baseline scenario calls for continued sideways trading within this narrow corridor. Should support at $75,680 give way, the risk of further declines increases, while a recovery above immediate resistance would be required to re-open short-term upside potential.
Earlier, analysts noted that Bitcoin faced persistent downside pressure amid institutional outflows and macroeconomic uncertainty, which limited its upside momentum. The current technical outlook strengthens this assessment, with continued weakness across key indicators suggesting traders should closely monitor the $75,680 support level for potential signs of further decline.


-
 Afghanistan
-
 Albania
-
 Algeria
-
 Angola
-
 Argentina
-
 Armenia
-
 Australia
-
 Austria
-
 Azerbaijan
-
 Bahamas
-
 Bahrain
-
 Bangladesh
-
 Belarus
-
 Belgium
-
 Bolivia
-
 Botswana
-
 Brazil
-
 Brunei
-
 Bulgaria
-
 Cambodia
-
 Cameroon
-
 Canada
-
 Chile
Chile
-
 China
China
-
 Colombia
-
 Congo
Congo
-
 Costa Rica
-
 Cote d'Ivoire
-
 Croatia
-
 Cuba
Cuba
-
 Cyprus
-
 Czechia
-
 DR Congo
-
 Denmark
-
 Dominican Republic
-
 Ecuador
-
 Egypt
Egypt
-
 El Salvador
-
 Estonia
-
 Eswatini
-
 Ethiopia
-
 Finland
-
 France
-
 Georgia
-
 Germany
-
 Ghana
Ghana
-
 Greece
-
 Haiti
Haiti
-
 Hong Kong
-
 Hungary
-
 India
India
-
 Indonesia
-
 Iran, Islamic republic
-
 Iraq
Iraq
-
 Ireland
-
 Israel
-
 Italy
Italy
-
 Jamaica
-
 Japan
Japan
-
 Jordan
-
 Kazakhstan
-
 Kenya
Kenya
-
 Korea
Korea
-
 Kuwait
-
 Kyrgyzstan
-
 Laos
Laos
-
 Latvia
-
 Lebanon
-
 Lesotho
-
 Libya
Libya
-
 Lithuania
-
 Luxembourg
-
 Madagascar
-
 Malaysia
-
 Malta
Malta
-
 Mauritius
-
 Mexico
-
 Moldova
-
 Mongolia
-
 Montenegro
-
 Morocco
-
 Mozambique
-
 Myanmar
-
 Namibia
-
 Nepal
Nepal
-
 Netherlands
-
 New Zealand
-
 Nigeria
-
 North Macedonia
-
 Norway
-
 Oman
Oman
-
 Pakistan
-
 Palestine
-
 Panama
-
 Papua New Guinea
-
 Paraguay
-
 Peru
Peru
-
 Philippines
-
 Poland
-
 Portugal
-
 Puerto Rico
-
 Qatar
Qatar
-
 Reunion
-
 Romania
-
 Rwanda
-
 Saudi Arabia
-
 Serbia
-
 Singapore
-
 Slovakia
-
 Slovenia
-
 Somalia
-
 South Africa
-
 Spain
Spain
-
 Sri Lanka
-
 Sweden
-
 Switzerland
-
 Syria
Syria
-
 Taiwan
-
 Tajikistan
-
 Tanzania
-
 Thailand
-
 Trinidad and Tobago
-
 Tunisia
-
 Turkey
-
 UAE
UAE
-
 Uganda
-
 Ukraine
-
 United Kingdom
-
United States
-
 Uruguay
-
 Uzbekistan
-
 Venezuela
-
 Vietnam
-
 Yemen
Yemen
-
 Zambia
-
 Zimbabwe
- Forex
- Crypto
