
NEAR consolidates as buyers remain strong above $2.40 support: weekly review

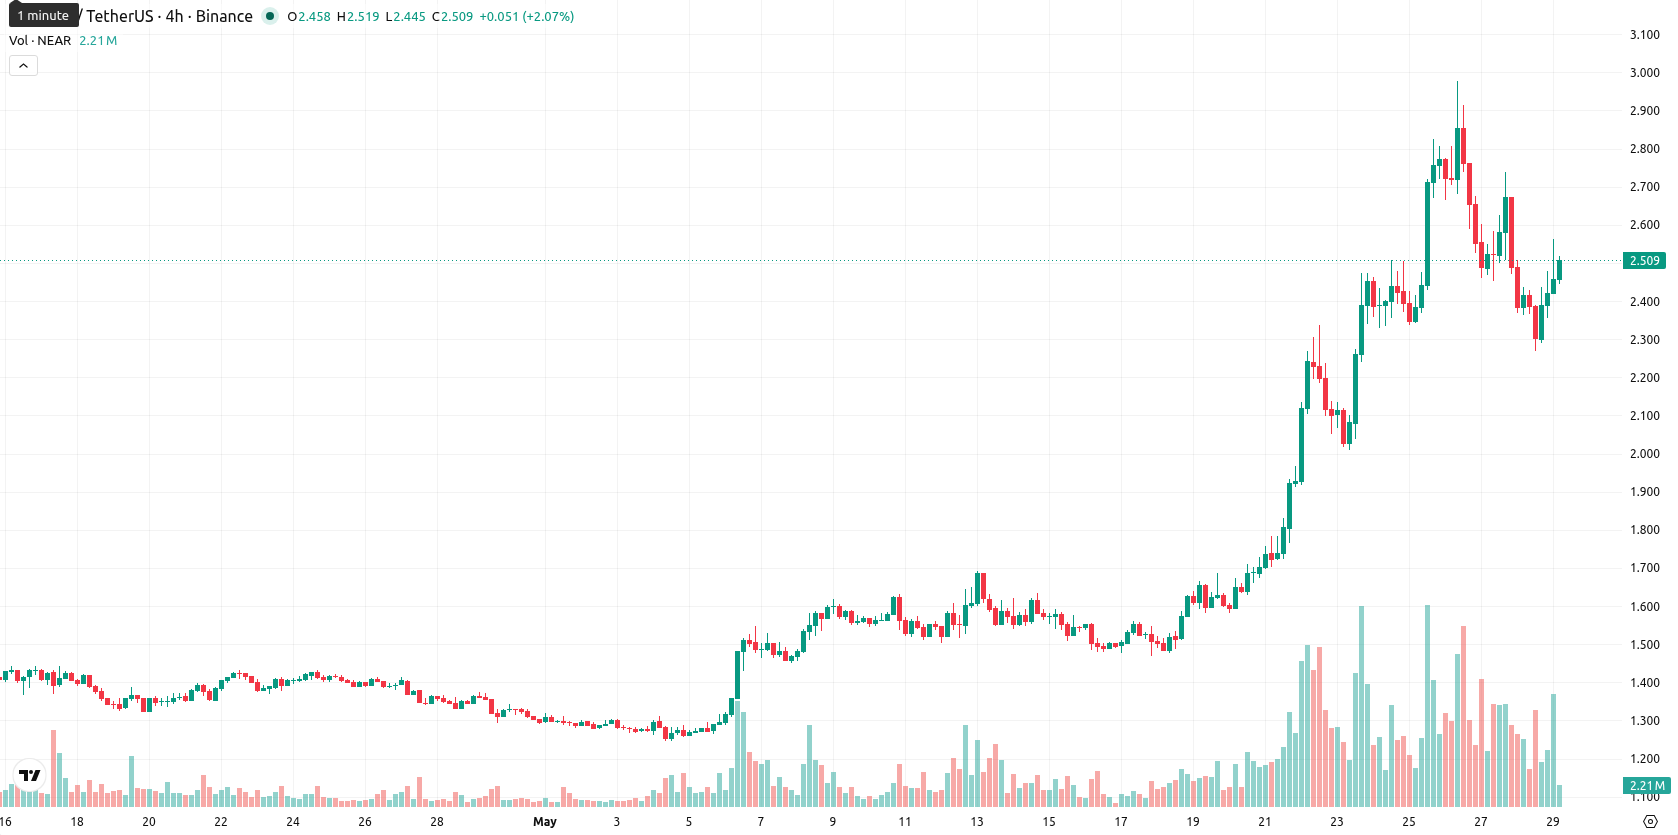
NEAR is currently trading above its weekly MA-20 ($1.3998) and MA-50 ($1.9572), but remains below MA-200 ($3.0438), suggesting medium-term bullish momentum with persistent long-term resistance overhead. Over the past week, NEAR has gained $0.29 (14.42%), remaining in the middle of its recent range and signaling a recovery from previous lows.
Highlights
- NEAR shows medium-term bullish momentum but faces long-term resistance, with buyers and sellers currently in balance.
- Oscillators indicate overbought conditions and exhaustion risk, despite persistent buyer dominance and recent 14.4% weekly gain.
- NEAR is likely to consolidate sideways between $2.40 and $2.53 this week, with a 75% probability of downside movement.
Neutral technical signals over the week amid mixed momentum and resistance
On the weekly timeframe, NEAR continues to show a mixed technical outlook. While it trades solidly above the MA-20 and MA-50, the MA-200 remains a significant ceiling for any sustained upside. Weekly indicators are neutral: the MACD and ADX lack clear directional cues, while overbought readings from the Stochastic RSI and CCI suggest caution. The RSI sits at 66 in buy territory, with Bull/Bear Power indicating continued buyer strength and the Awesome Oscillator supporting the positive momentum. Support lies at $2.40 and MA-50 ($1.96), with resistance seen at $2.53.
Sideways consolidation likely this week as trend conviction weakens
Looking ahead to the next 7 days, NEAR is likely to consolidate sideways between $2.40 and $2.53 as weekly momentum lacks a decisive trend. With only 1 out of 4 key indicators signaling 'Buy' or 'Strong Buy', there is a 75% probability of a near-term pullback versus 25% odds for continued gains. A bullish outcome would require a break above $2.53 to target short-term highs, while a drop below the $2.40 support could open downside toward the dynamic MA-50 level near $1.96.
In a recent review, analysts highlighted that NEAR maintained a bullish bias despite caution over elevated volatility and a rising risk of short-term reversal. The current analysis adds that while medium-term momentum remains positive, traders should monitor the $2.53 resistance as a key threshold for any breakout in the week ahead.


-
 Afghanistan
-
 Albania
-
 Algeria
-
 Angola
-
 Argentina
-
 Armenia
-
 Australia
-
 Austria
-
 Azerbaijan
-
 Bahamas
-
 Bahrain
-
 Bangladesh
-
 Belarus
-
 Belgium
-
 Bolivia
-
 Botswana
-
 Brazil
-
 Brunei
-
 Bulgaria
-
 Cambodia
-
 Cameroon
-
 Canada
-
 Chile
Chile
-
 China
China
-
 Colombia
-
 Congo
Congo
-
 Costa Rica
-
 Cote d'Ivoire
-
 Croatia
-
 Cuba
Cuba
-
 Cyprus
-
 Czechia
-
 DR Congo
-
 Denmark
-
 Dominican Republic
-
 Ecuador
-
 Egypt
Egypt
-
 El Salvador
-
 Estonia
-
 Eswatini
-
 Ethiopia
-
 Finland
-
 France
-
 Georgia
-
 Germany
-
 Ghana
Ghana
-
 Greece
-
 Haiti
Haiti
-
 Hong Kong
-
 Hungary
-
 India
India
-
 Indonesia
-
 Iran, Islamic republic
-
 Iraq
Iraq
-
 Ireland
-
 Israel
-
 Italy
Italy
-
 Jamaica
-
 Japan
Japan
-
 Jordan
-
 Kazakhstan
-
 Kenya
Kenya
-
 Korea
Korea
-
 Kuwait
-
 Kyrgyzstan
-
 Laos
Laos
-
 Latvia
-
 Lebanon
-
 Lesotho
-
 Libya
Libya
-
 Lithuania
-
 Luxembourg
-
 Madagascar
-
 Malaysia
-
 Malta
Malta
-
 Mauritius
-
 Mexico
-
 Moldova
-
 Mongolia
-
 Montenegro
-
 Morocco
-
 Mozambique
-
 Myanmar
-
 Namibia
-
 Nepal
Nepal
-
 Netherlands
-
 New Zealand
-
 Nigeria
-
 North Macedonia
-
 Norway
-
 Oman
Oman
-
 Pakistan
-
 Palestine
-
 Panama
-
 Papua New Guinea
-
 Paraguay
-
 Peru
Peru
-
 Philippines
-
 Poland
-
 Portugal
-
 Puerto Rico
-
 Qatar
Qatar
-
 Reunion
-
 Romania
-
 Rwanda
-
 Saudi Arabia
-
 Serbia
-
 Singapore
-
 Slovakia
-
 Slovenia
-
 Somalia
-
 South Africa
-
 Spain
Spain
-
 Sri Lanka
-
 Sweden
-
 Switzerland
-
 Syria
Syria
-
 Taiwan
-
 Tajikistan
-
 Tanzania
-
 Thailand
-
 Trinidad and Tobago
-
 Tunisia
-
 Turkey
-
 UAE
UAE
-
 Uganda
-
 Ukraine
-
 United Kingdom
-
United States
-
 Uruguay
-
 Uzbekistan
-
 Venezuela
-
 Vietnam
-
 Yemen
Yemen
-
 Zambia
-
 Zimbabwe
- Forex
- Crypto
