
Celestia price prediction: Key $0.3400 support tested as TIA slides

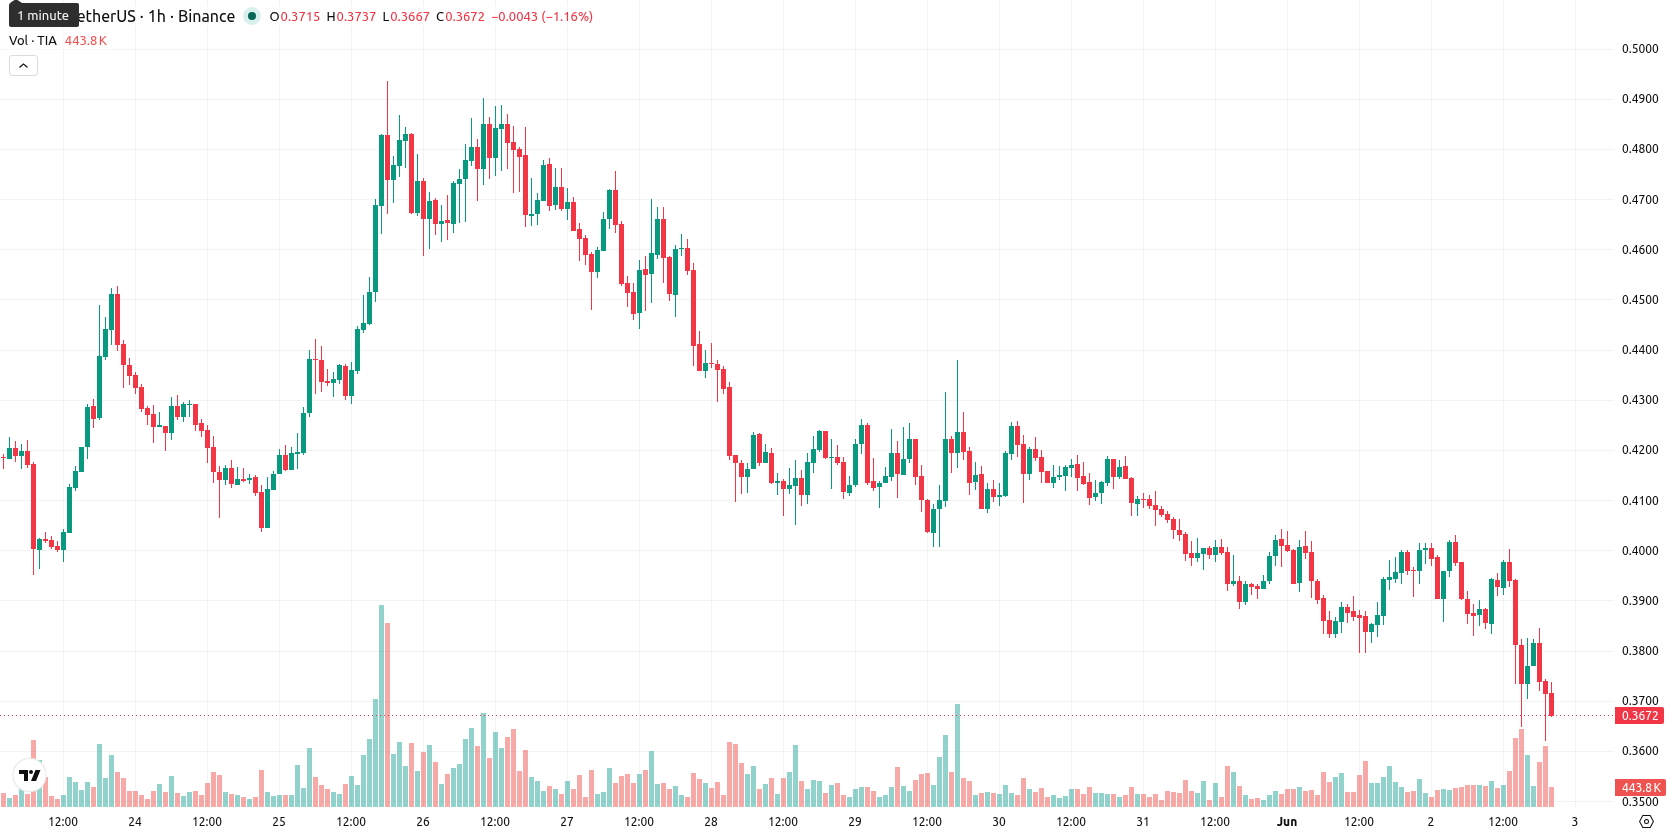
Celestia (TIA) is trading at $0.3679 after a daily decline of 7.42%. The asset remains below its key moving averages, reflecting ongoing downward momentum.
Highlights
- TIA remains in a bearish trend, trading below major moving averages and under heavy sell pressure across all timeframes.
- Technical momentum is weak despite oversold conditions, with most indicators reinforcing short-term downside risk as buyers remain absent.
- Expected trading range for the week is $0.3400–$0.4050, with a probability of further decline exceeding 80% unless resistance breaks.
Oversold readings and mixed momentum signal fragile support
The MA-20 is at $0.4207, MA-50 at $0.3948, and MA-200 at $0.4341, while the Ichimoku Kijun on the D1 timeframe stands at $0.4441 as notable resistance. Momentum indicators show conflicting signals: MACD flashes a strong buy, but ADX reflects only mild trend strength. RSI sits at 46.45, CCI at -89.29, and Stoch RSI at 0.00, all highlighting oversold conditions, while BBP confirms continued seller dominance. The Awesome Oscillator supports further weakness, underlining the prevailing downtrend.
Further downside risk as sellers dominate short-term outlook
For the coming week, TIA is expected to trade within the $0.3400–$0.4050 band, representing typical volatility near current levels. The probability of an upward move is less than 20%, favoring further declines as the most likely scenario. Baseline expectations see TIA consolidating between support and resistance. A break above $0.4050 could trigger short covering, while a drop below $0.3400 would expose the asset to deeper losses, as overall momentum remains with sellers.
Earlier, analysts noted that Celestia was exhibiting ongoing bearish momentum with limited prospects for a near-term reversal. The persistence of oversold readings and continued seller dominance in the latest data reinforce a downside bias, making potential breakdowns below $0.3400 a key risk to monitor for further losses.


-
 Afghanistan
-
 Albania
-
 Algeria
-
 Angola
-
 Argentina
-
 Armenia
-
 Australia
-
 Austria
-
 Azerbaijan
-
 Bahamas
-
 Bahrain
-
 Bangladesh
-
 Belarus
-
 Belgium
-
 Bolivia
-
 Botswana
-
 Brazil
-
 Brunei
-
 Bulgaria
-
 Cambodia
-
 Cameroon
-
 Canada
-
 Chile
Chile
-
 China
China
-
 Colombia
-
 Congo
Congo
-
 Costa Rica
-
 Cote d'Ivoire
-
 Croatia
-
 Cuba
Cuba
-
 Cyprus
-
 Czechia
-
 DR Congo
-
 Denmark
-
 Dominican Republic
-
 Ecuador
-
 Egypt
Egypt
-
 El Salvador
-
 Estonia
-
 Eswatini
-
 Ethiopia
-
 Finland
-
 France
-
 Georgia
-
 Germany
-
 Ghana
Ghana
-
 Greece
-
 Haiti
Haiti
-
 Hong Kong
-
 Hungary
-
 India
India
-
 Indonesia
-
 Iran, Islamic republic
-
 Iraq
Iraq
-
 Ireland
-
 Israel
-
 Italy
Italy
-
 Jamaica
-
 Japan
Japan
-
 Jordan
-
 Kazakhstan
-
 Kenya
Kenya
-
 Korea
Korea
-
 Kuwait
-
 Kyrgyzstan
-
 Laos
Laos
-
 Latvia
-
 Lebanon
-
 Lesotho
-
 Libya
Libya
-
 Lithuania
-
 Luxembourg
-
 Madagascar
-
 Malaysia
-
 Malta
Malta
-
 Mauritius
-
 Mexico
-
 Moldova
-
 Mongolia
-
 Montenegro
-
 Morocco
-
 Mozambique
-
 Myanmar
-
 Namibia
-
 Nepal
Nepal
-
 Netherlands
-
 New Zealand
-
 Nigeria
-
 North Macedonia
-
 Norway
-
 Oman
Oman
-
 Pakistan
-
 Palestine
-
 Panama
-
 Papua New Guinea
-
 Paraguay
-
 Peru
Peru
-
 Philippines
-
 Poland
-
 Portugal
-
 Puerto Rico
-
 Qatar
Qatar
-
 Reunion
-
 Romania
-
 Rwanda
-
 Saudi Arabia
-
 Serbia
-
 Singapore
-
 Slovakia
-
 Slovenia
-
 Somalia
-
 South Africa
-
 Spain
Spain
-
 Sri Lanka
-
 Sweden
-
 Switzerland
-
 Syria
Syria
-
 Taiwan
-
 Tajikistan
-
 Tanzania
-
 Thailand
-
 Trinidad and Tobago
-
 Tunisia
-
 Turkey
-
 UAE
UAE
-
 Uganda
-
 Ukraine
-
 United Kingdom
-
United States
-
 Uruguay
-
 Uzbekistan
-
 Venezuela
-
 Vietnam
-
 Yemen
Yemen
-
 Zambia
-
 Zimbabwe
- Forex
- Crypto
