
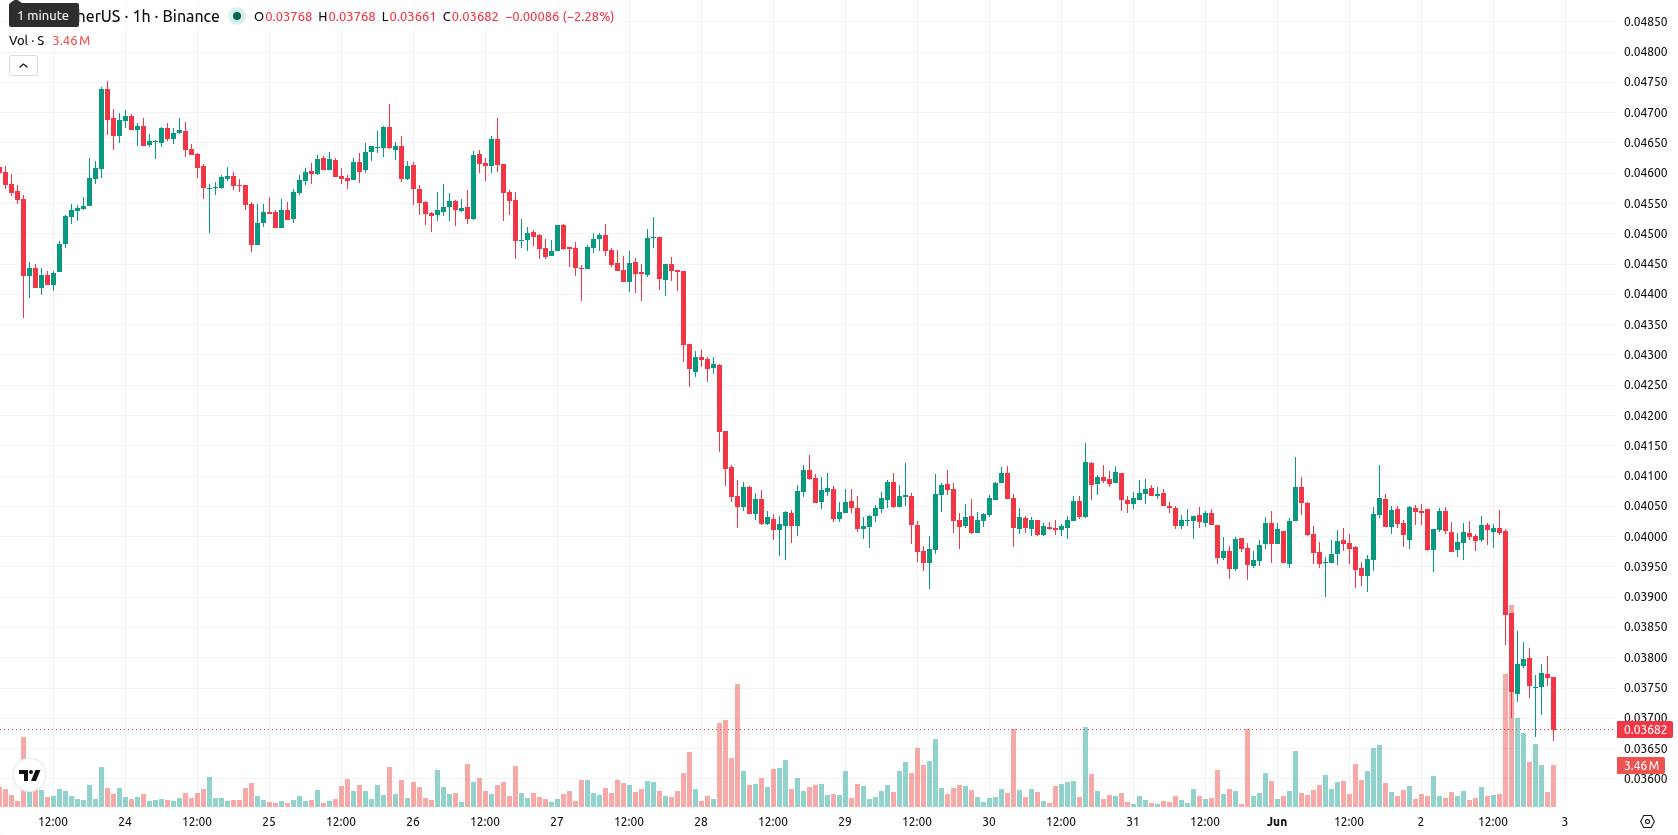
Limited further selling keeps Sonic above $0.035 key support

Sonic (S, formerly Fantom) is trading at $0.037, down 8.49% on the day. The asset currently sits well below its key moving averages, reflecting persistent short-term and longer-term pressure.
Highlights
- S trades well beneath major moving averages, confirming sustained bearish pressure across all time frames.
- Bearish momentum dominates, with multiple indicators approaching oversold territory, and intraday volatility remains elevated.
- The projected five-session range is $0.035–$0.041, with further declines much more probable than an upside reversal.
Oversold signals as weak momentum meets layered resistance
The price is below the SMA-20 at $0.0444, SMA-50 at $0.0454, and SMA-200 at $0.0618. The Ichimoku Kijun at $0.0488 marks immediate resistance. Momentum indicators remain weak: the MACD and ADX show diminishing trend strength, while RSI at 38 and CCI at -125 indicate near-oversold conditions. Stoch RSI is firmly in oversold territory, and BBP remains negative, pointing to continued seller dominance. The Awesome Oscillator (AO) aligns with this weakness, and the price has traded near today’s low within a volatile session with no major divergences in oscillators.
Limited upside amid prevailing downtrend and heightened volatility
Over the next five sessions, the anticipated price range is $0.035–$0.041, consistent with prevailing volatility. The probability of an upside move is estimated at less than 20%, making further declines the favored scenario. Baseline expectation calls for S to trade sideways within these bounds. A move above $0.041 could prompt a rebound toward resistance at $0.0488, while a drop below $0.035 may accelerate the downtrend.
Earlier, analysts noted that Sonic was entrenched in bearish momentum, with downside risks prevalent due to persistent selling pressure. The current analysis reinforces this view, highlighting that traders should remain alert to the risk of further declines if support at $0.035 fails to hold during heightened volatility.


-
 Afghanistan
-
 Albania
-
 Algeria
-
 Angola
-
 Argentina
-
 Armenia
-
 Australia
-
 Austria
-
 Azerbaijan
-
 Bahamas
-
 Bahrain
-
 Bangladesh
-
 Belarus
-
 Belgium
-
 Bolivia
-
 Botswana
-
 Brazil
-
 Brunei
-
 Bulgaria
-
 Cambodia
-
 Cameroon
-
 Canada
-
 Chile
Chile
-
 China
China
-
 Colombia
-
 Congo
Congo
-
 Costa Rica
-
 Cote d'Ivoire
-
 Croatia
-
 Cuba
Cuba
-
 Cyprus
-
 Czechia
-
 DR Congo
-
 Denmark
-
 Dominican Republic
-
 Ecuador
-
 Egypt
Egypt
-
 El Salvador
-
 Estonia
-
 Eswatini
-
 Ethiopia
-
 Finland
-
 France
-
 Georgia
-
 Germany
-
 Ghana
Ghana
-
 Greece
-
 Haiti
Haiti
-
 Hong Kong
-
 Hungary
-
 India
India
-
 Indonesia
-
 Iran, Islamic republic
-
 Iraq
Iraq
-
 Ireland
-
 Israel
-
 Italy
Italy
-
 Jamaica
-
 Japan
Japan
-
 Jordan
-
 Kazakhstan
-
 Kenya
Kenya
-
 Korea
Korea
-
 Kuwait
-
 Kyrgyzstan
-
 Laos
Laos
-
 Latvia
-
 Lebanon
-
 Lesotho
-
 Libya
Libya
-
 Lithuania
-
 Luxembourg
-
 Madagascar
-
 Malaysia
-
 Malta
Malta
-
 Mauritius
-
 Mexico
-
 Moldova
-
 Mongolia
-
 Montenegro
-
 Morocco
-
 Mozambique
-
 Myanmar
-
 Namibia
-
 Nepal
Nepal
-
 Netherlands
-
 New Zealand
-
 Nigeria
-
 North Macedonia
-
 Norway
-
 Oman
Oman
-
 Pakistan
-
 Palestine
-
 Panama
-
 Papua New Guinea
-
 Paraguay
-
 Peru
Peru
-
 Philippines
-
 Poland
-
 Portugal
-
 Puerto Rico
-
 Qatar
Qatar
-
 Reunion
-
 Romania
-
 Rwanda
-
 Saudi Arabia
-
 Serbia
-
 Singapore
-
 Slovakia
-
 Slovenia
-
 Somalia
-
 South Africa
-
 Spain
Spain
-
 Sri Lanka
-
 Sweden
-
 Switzerland
-
 Syria
Syria
-
 Taiwan
-
 Tajikistan
-
 Tanzania
-
 Thailand
-
 Trinidad and Tobago
-
 Tunisia
-
 Turkey
-
 UAE
UAE
-
 Uganda
-
 Ukraine
-
 United Kingdom
-
United States
-
 Uruguay
-
 Uzbekistan
-
 Venezuela
-
 Vietnam
-
 Yemen
Yemen
-
 Zambia
-
 Zimbabwe
- Forex
- Crypto
