
The Graph slides with lack of bullish momentum keeping price under pressure

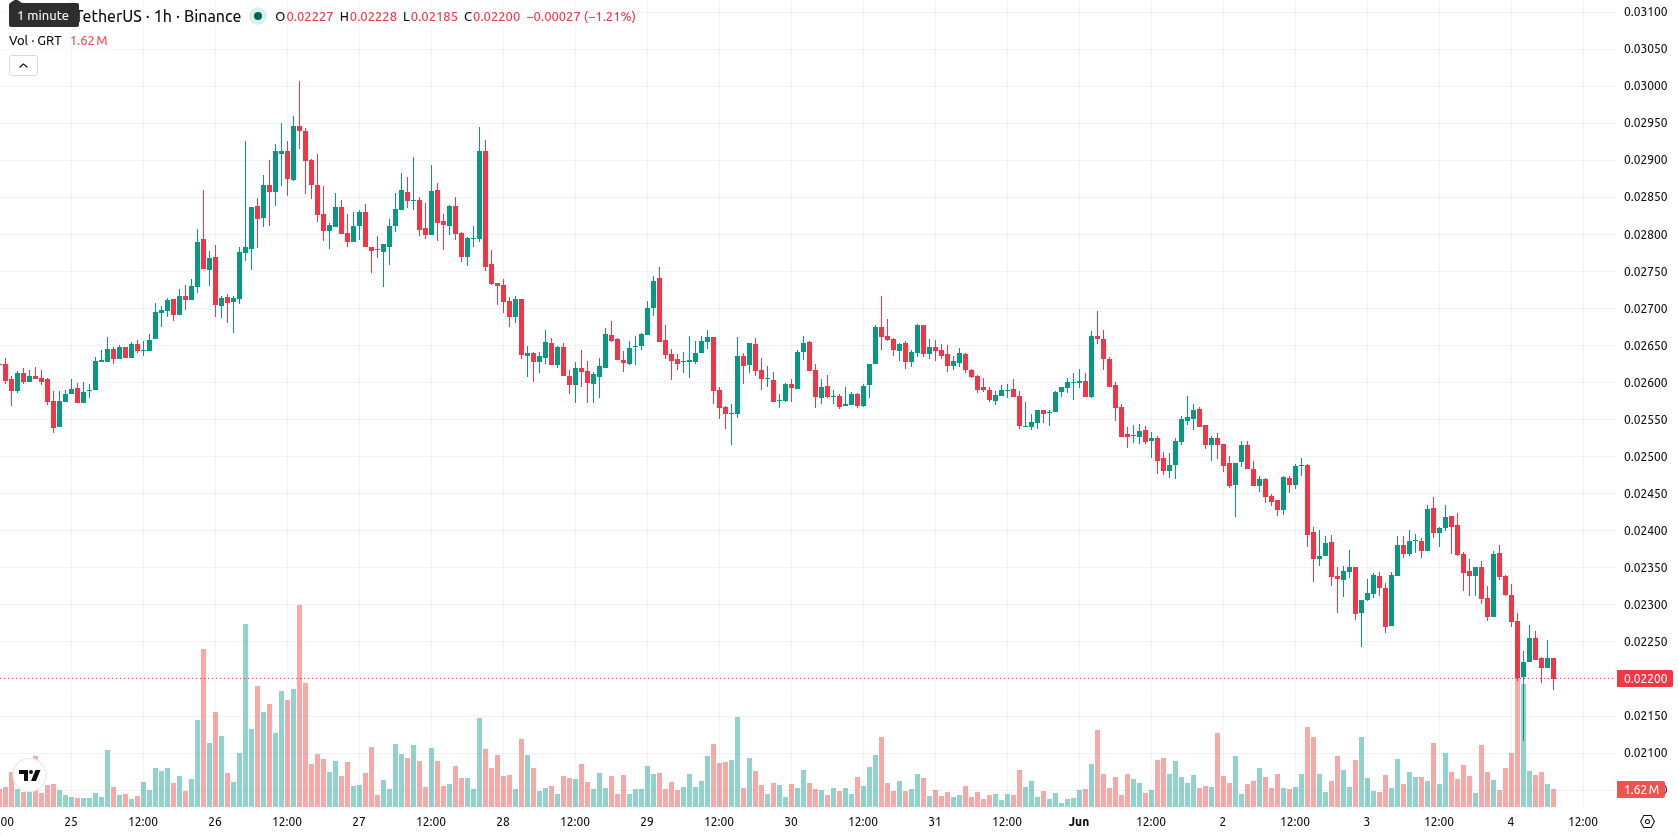
The Graph (GRT) is trading at $0.021944, marking a decline of 8.41% for the day. The price currently sits below its key moving averages.
Highlights
- GRT/USD trades below key moving averages across all timeframes, confirming strong bearish momentum in the near term.
- Bearish technical signals dominate as multiple oscillators and momentum indicators show persistent seller control despite short-term volatility.
- Price is projected to consolidate between $0.01996 and $0.02393 over three days, with low upside probability and risk of a further breakdown if support fails.
Bearish momentum prevails as indicators confirm resistance pressure
GRT/USD is positioned below the MA-20 ($0.02314090) and MA-50 ($0.02356416) on the hourly chart, and remains well beneath the MA-200 ($0.03212670) on the daily timeframe. The Ichimoku Kijun at $0.02280500 is acting as immediate resistance. Technical indicators confirm prevailing bearish momentum: MACD, ADX, RSI (40.28, Sell), CCI, and BBP all highlight seller dominance, while Stoch RSI indicates a Buy. The Awesome Oscillator (AO) remains neutral and does not reinforce the current price movement.
Downside risk grows as range-bound outlook dominates
Over the next three days, GRT/USD is projected to fluctuate within the $0.01995716 to $0.02393084 volatility band relative to current levels. The likelihood of upward price movement is very low, while a downside break is much more probable. Baseline expectations call for consolidation within this range; a bullish scenario would require a clear break above immediate resistance, whereas a close below the lower boundary could signal renewed downside momentum.
Earlier, analysts noted that The Graph was experiencing sustained bearish momentum with limited signs of recovery in the near term. Fresh technical evidence now strengthens this view, underscoring increased downside risk should GRT fail to hold above immediate support during ongoing consolidation.


-
 Afghanistan
-
 Albania
-
 Algeria
-
 Angola
-
 Argentina
-
 Armenia
-
 Australia
-
 Austria
-
 Azerbaijan
-
 Bahamas
-
 Bahrain
-
 Bangladesh
-
 Belarus
-
 Belgium
-
 Bolivia
-
 Botswana
-
 Brazil
-
 Brunei
-
 Bulgaria
-
 Cambodia
-
 Cameroon
-
 Canada
-
 Chile
Chile
-
 China
China
-
 Colombia
-
 Congo
Congo
-
 Costa Rica
-
 Cote d'Ivoire
-
 Croatia
-
 Cuba
Cuba
-
 Cyprus
-
 Czechia
-
 DR Congo
-
 Denmark
-
 Dominican Republic
-
 Ecuador
-
 Egypt
Egypt
-
 El Salvador
-
 Estonia
-
 Eswatini
-
 Ethiopia
-
 Finland
-
 France
-
 Georgia
-
 Germany
-
 Ghana
Ghana
-
 Greece
-
 Haiti
Haiti
-
 Hong Kong
-
 Hungary
-
 India
India
-
 Indonesia
-
 Iran, Islamic republic
-
 Iraq
Iraq
-
 Ireland
-
 Israel
-
 Italy
Italy
-
 Jamaica
-
 Japan
Japan
-
 Jordan
-
 Kazakhstan
-
 Kenya
Kenya
-
 Korea
Korea
-
 Kuwait
-
 Kyrgyzstan
-
 Laos
Laos
-
 Latvia
-
 Lebanon
-
 Lesotho
-
 Libya
Libya
-
 Lithuania
-
 Luxembourg
-
 Madagascar
-
 Malaysia
-
 Malta
Malta
-
 Mauritius
-
 Mexico
-
 Moldova
-
 Mongolia
-
 Montenegro
-
 Morocco
-
 Mozambique
-
 Myanmar
-
 Namibia
-
 Nepal
Nepal
-
 Netherlands
-
 New Zealand
-
 Nigeria
-
 North Macedonia
-
 Norway
-
 Oman
Oman
-
 Pakistan
-
 Palestine
-
 Panama
-
 Papua New Guinea
-
 Paraguay
-
 Peru
Peru
-
 Philippines
-
 Poland
-
 Portugal
-
 Puerto Rico
-
 Qatar
Qatar
-
 Reunion
-
 Romania
-
 Rwanda
-
 Saudi Arabia
-
 Serbia
-
 Singapore
-
 Slovakia
-
 Slovenia
-
 Somalia
-
 South Africa
-
 Spain
Spain
-
 Sri Lanka
-
 Sweden
-
 Switzerland
-
 Syria
Syria
-
 Taiwan
-
 Tajikistan
-
 Tanzania
-
 Thailand
-
 Trinidad and Tobago
-
 Tunisia
-
 Turkey
-
 UAE
UAE
-
 Uganda
-
 Ukraine
-
 United Kingdom
-
United States
-
 Uruguay
-
 Uzbekistan
-
 Venezuela
-
 Vietnam
-
 Yemen
Yemen
-
 Zambia
-
 Zimbabwe
- Forex
- Crypto
