
Bitcoin declines after Federal Reserve signals high interest rates

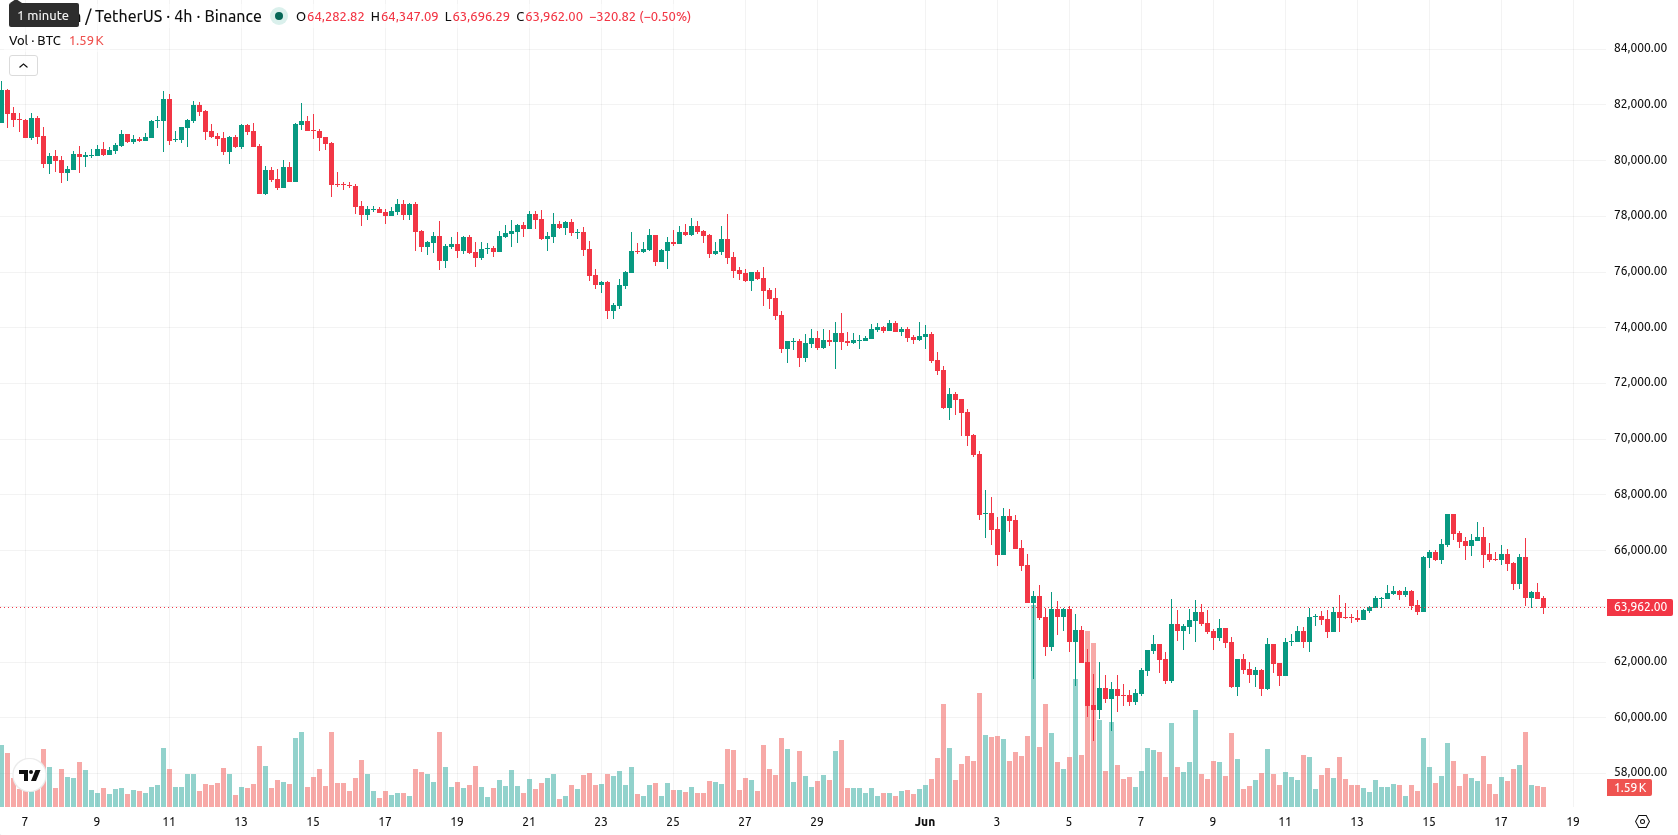
Bitcoin (BTC) is trading at $63,851.10, down 3.09% for the day and marking a notable dip near the session low on moderate volatility. The asset currently sits below its key moving averages, suggesting increased downside pressure over the short term.
Highlights
- Bitcoin dropped to around $64,000 as heightened Middle East tensions and Federal Reserve uncertainty fueled risk-off sentiment.
- Prospects for a U.S.-Iran ceasefire remain unsettled, leaving oil supply and inflation expectations highly sensitive to further geopolitical developments.
- Technical signals remain bearish with Bitcoin trading below key averages, expected to range between $61,855.48 and $68,202.02 amid oversold momentum.
Hawkish Fed and Mideast tensions drive risk-off flows into Bitcoin
On Wednesday, Bitcoin has fallen to around $64,000 amid escalating tensions in the Middle East, with Iran threatening Israel and investors responding to uncertainty linked to the Federal Reserve's imminent rate decision. Renewal of hostilities involving Israel and Lebanon has weakened optimism for a potential U.S.-Iran agreement, further increasing regional risk. Hawkish signals from the Federal Reserve, coupled with continued high interest rates, have reduced the appeal of Bitcoin versus safer assets. The U.S./Iran preliminary memorandum of understanding for ceasefire and sanctions relief has been signed but pending concrete nuclear and sanctions terms in a 60-day window, leaving oil supply and inflation expectations highly sensitive to successive geopolitical updates.
Bearish bias holds as momentum weakens and oversold signals build
BTC/USD is trading below the MA-20 at $65,757.09, MA-50 at $64,252.71, and the long-term MA-200 at $77,300.05. The Ichimoku Kijun stands at $65,485.49, currently acting as immediate resistance. Momentum is mixed with MACD and ADX both reading neutral, while RSI registers a bearish 43.52. Stoch RSI and CCI indicate oversold territory, and BBP confirms intraday seller dominance. Awesome Oscillator signals a strong sell bias, reflecting persistent bearish pressure, though oscillators diverge with several oversold readings.
Downside risk prevails as range persists pending breakout trigger
In the short term, BTC/USD is expected to remain within a volatility band between $61,855.48 and $68,202.02. Upward movement probability is 37%, while a larger 63% chance remains for continued downside. The primary scenario anticipates price holding within the established range, with a bullish breakout requiring a decisive close above immediate resistance and a bearish extension occurring if current support is breached.
Earlier, analysts noted that Bitcoin was facing continued downside risk amid negative momentum and fragile technical signals. With the current escalation of geopolitical tensions and hawkish Federal Reserve signals compounding bearish pressure, the crucial level to watch now is support at $61,855.48, as a sustained break below this could accelerate further declines.


Latest Bitcoin News


-
 Afghanistan
-
 Albania
-
 Algeria
-
 Angola
-
 Argentina
-
 Armenia
-
 Australia
-
 Austria
-
 Azerbaijan
-
 Bahamas
-
 Bahrain
-
 Bangladesh
-
 Belarus
-
 Belgium
-
 Bolivia
-
 Botswana
-
 Brazil
-
 Brunei
-
 Bulgaria
-
 Cambodia
-
 Cameroon
-
 Canada
-
 Chile
Chile
-
 China
China
-
 Colombia
-
 Congo
Congo
-
 Costa Rica
-
 Cote d'Ivoire
-
 Croatia
-
 Cuba
Cuba
-
 Cyprus
-
 Czechia
-
 DR Congo
-
 Denmark
-
 Dominican Republic
-
 Ecuador
-
 Egypt
Egypt
-
 El Salvador
-
 Estonia
-
 Eswatini
-
 Ethiopia
-
 Finland
-
 France
-
 Georgia
-
 Germany
-
 Ghana
Ghana
-
 Greece
-
 Haiti
Haiti
-
 Hong Kong
-
 Hungary
-
 India
India
-
 Indonesia
-
 Iran, Islamic republic
-
 Iraq
Iraq
-
 Ireland
-
 Israel
-
 Italy
Italy
-
 Jamaica
-
 Japan
Japan
-
 Jordan
-
 Kazakhstan
-
 Kenya
Kenya
-
 Korea
Korea
-
 Kuwait
-
 Kyrgyzstan
-
 Laos
Laos
-
 Latvia
-
 Lebanon
-
 Lesotho
-
 Libya
Libya
-
 Lithuania
-
 Luxembourg
-
 Madagascar
-
 Malaysia
-
 Malta
Malta
-
 Mauritius
-
 Mexico
-
 Moldova
-
 Mongolia
-
 Montenegro
-
 Morocco
-
 Mozambique
-
 Myanmar
-
 Namibia
-
 Nepal
Nepal
-
 Netherlands
-
 New Zealand
-
 Nigeria
-
 North Macedonia
-
 Norway
-
 Oman
Oman
-
 Pakistan
-
 Palestine
-
 Panama
-
 Papua New Guinea
-
 Paraguay
-
 Peru
Peru
-
 Philippines
-
 Poland
-
 Portugal
-
 Puerto Rico
-
 Qatar
Qatar
-
 Reunion
-
 Romania
-
 Rwanda
-
 Saudi Arabia
-
 Serbia
-
 Singapore
-
 Slovakia
-
 Slovenia
-
 Somalia
-
 South Africa
-
 Spain
Spain
-
 Sri Lanka
-
 Sweden
-
 Switzerland
-
 Syria
Syria
-
 Taiwan
-
 Tajikistan
-
 Tanzania
-
 Thailand
-
 Trinidad and Tobago
-
 Tunisia
-
 Turkey
-
 UAE
UAE
-
 Uganda
-
 Ukraine
-
 United Kingdom
-
United States
-
 Uruguay
-
 Uzbekistan
-
 Venezuela
-
 Vietnam
-
 Yemen
Yemen
-
 Zambia
-
 Zimbabwe
- Forex
- Crypto
