
Stellar price prediction: Bearish control dominates the $0.1845–$0.2071 range? XLM falls 7.82%

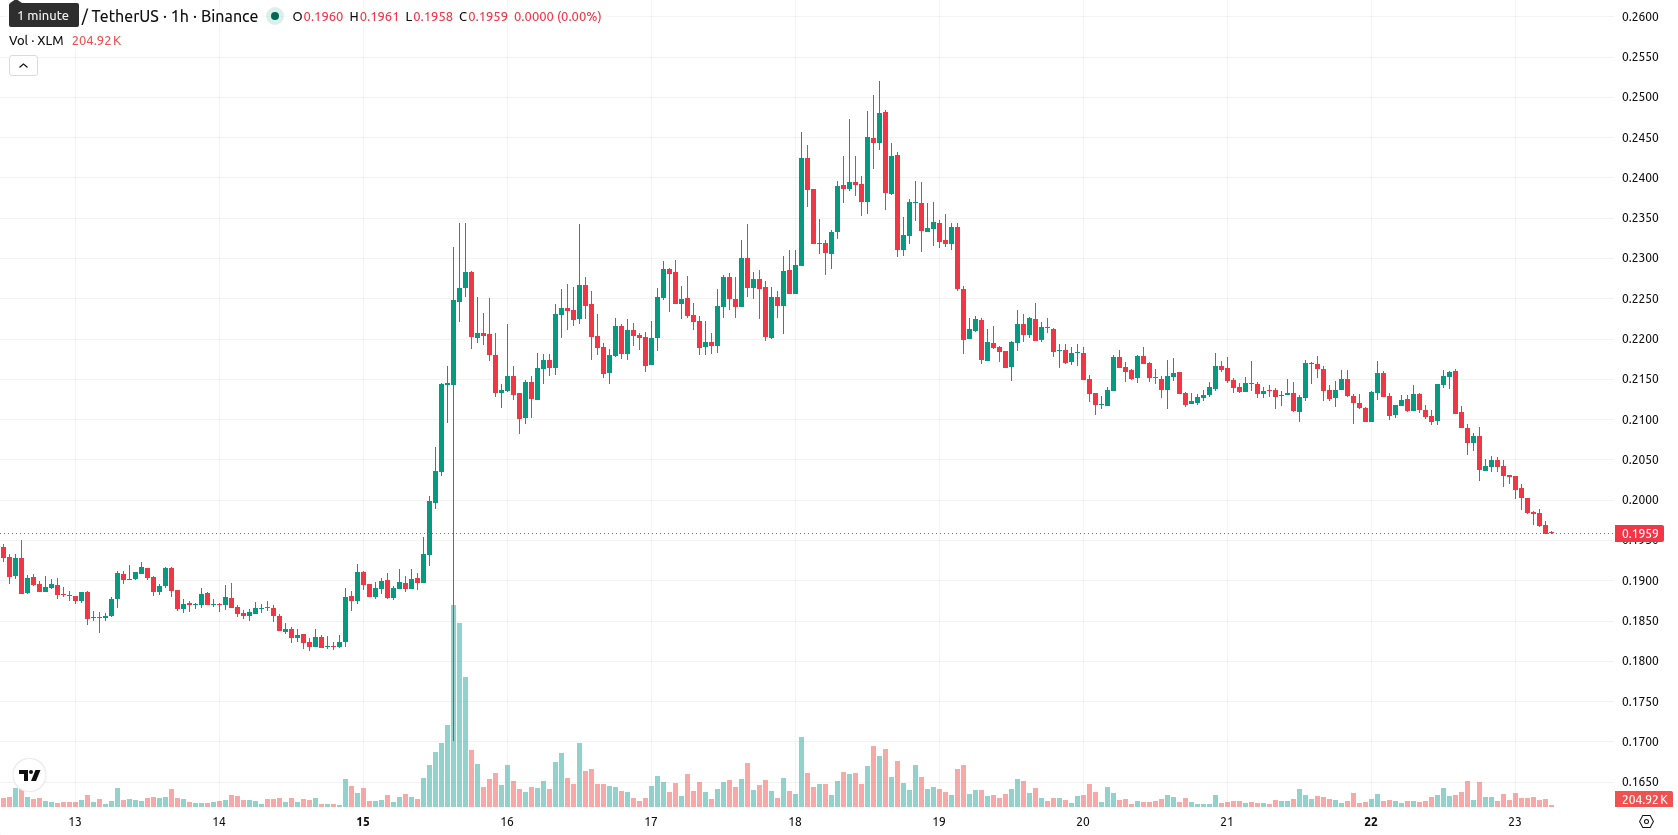
Stellar (XLM) is trading at $0.1958, down 7.82% on the day and hovering near its daily low amid elevated volatility. The asset sits below its key short- and medium-term moving averages but remains above its primary long-term average.
Highlights
- DTCC's planned integration of its asset tokenization service with Stellar signals rising institutional adoption potential for the network.
- MoneyGram's recent launch of the MGUSD stablecoin on Stellar underscores expanding U.S. retail payment use despite continued price pressure.
- XLM/USD trades below key moving averages and faces strong downside momentum, with the expected short-term range at $0.1845 to $0.2071 and a high probability of further declines.
Institutional flows eyed as settlement integrations lift adoption prospects
DTCC announced plans to integrate its tokenization service with the Stellar blockchain for asset settlement, according to Pluang. This development signals the network's potential to capture new institutional settlement flows as the initiative progresses. MoneyGram's recent launch of the MGUSD USD stablecoin on Stellar for the U.S. market further demonstrates ongoing platform adoption for retail payments, though price action has remained under broader selling pressure.
Persistent downside as negative momentum aligns with oversold signals
XLM/USD is positioned below the 20- and 50-day moving averages, while remaining above the 200-day level. The Ichimoku Kijun line provides resistance at $0.2066. Momentum indicators confirm a negative bias: MACD and ADX show strong sell readings, while the RSI at 25.8, along with Stoch RSI and CCI, points to oversold conditions without an active rebound. The Bull/Bear Power indicator confirms intraday seller dominance, and the Awesome Oscillator supports the prevailing negative momentum.
Lower break risk elevated as volatility constrains rebound chances
In the short term, XLM/USD is expected to trade within a bandwidth of $0.1845 to $0.2071, reflecting the current high volatility. The probability of an upward breakout is considered very low, with a much higher chance of further declines if support at the lower end of the range gives way. For now, price movement is likely to persist within this volatility band, absent a decisive move above resistance.
Earlier, analysts noted that Stellar’s long-term structure remained bullish despite heightened volatility and short-term overbought signals. The latest price action, placing XLM below key short-term averages while institutional adoption accelerates, marks a shift to a more cautious scenario, with sustained downside risk should the $0.1845 support give way in the sessions ahead.


Latest Stellar News


-
 Afghanistan
-
 Albania
-
 Algeria
-
 Angola
-
 Argentina
-
 Armenia
-
 Australia
-
 Austria
-
 Azerbaijan
-
 Bahamas
-
 Bahrain
-
 Bangladesh
-
 Belarus
-
 Belgium
-
 Bolivia
-
 Botswana
-
 Brazil
-
 Brunei
-
 Bulgaria
-
 Cambodia
-
 Cameroon
-
 Canada
-
 Chile
Chile
-
 China
China
-
 Colombia
-
 Congo
Congo
-
 Costa Rica
-
 Cote d'Ivoire
-
 Croatia
-
 Cuba
Cuba
-
 Cyprus
-
 Czechia
-
 DR Congo
-
 Denmark
-
 Dominican Republic
-
 Ecuador
-
 Egypt
Egypt
-
 El Salvador
-
 Estonia
-
 Eswatini
-
 Ethiopia
-
 Finland
-
 France
-
 Georgia
-
 Germany
-
 Ghana
Ghana
-
 Greece
-
 Haiti
Haiti
-
 Hong Kong
-
 Hungary
-
 India
India
-
 Indonesia
-
 Iran, Islamic republic
-
 Iraq
Iraq
-
 Ireland
-
 Israel
-
 Italy
Italy
-
 Jamaica
-
 Japan
Japan
-
 Jordan
-
 Kazakhstan
-
 Kenya
Kenya
-
 Korea
Korea
-
 Kuwait
-
 Kyrgyzstan
-
 Laos
Laos
-
 Latvia
-
 Lebanon
-
 Lesotho
-
 Libya
Libya
-
 Lithuania
-
 Luxembourg
-
 Madagascar
-
 Malaysia
-
 Malta
Malta
-
 Mauritius
-
 Mexico
-
 Moldova
-
 Mongolia
-
 Montenegro
-
 Morocco
-
 Mozambique
-
 Myanmar
-
 Namibia
-
 Nepal
Nepal
-
 Netherlands
-
 New Zealand
-
 Nigeria
-
 North Macedonia
-
 Norway
-
 Oman
Oman
-
 Pakistan
-
 Palestine
-
 Panama
-
 Papua New Guinea
-
 Paraguay
-
 Peru
Peru
-
 Philippines
-
 Poland
-
 Portugal
-
 Puerto Rico
-
 Qatar
Qatar
-
 Reunion
-
 Romania
-
 Rwanda
-
 Saudi Arabia
-
 Serbia
-
 Singapore
-
 Slovakia
-
 Slovenia
-
 Somalia
-
 South Africa
-
 Spain
Spain
-
 Sri Lanka
-
 Sweden
-
 Switzerland
-
 Syria
Syria
-
 Taiwan
-
 Tajikistan
-
 Tanzania
-
 Thailand
-
 Trinidad and Tobago
-
 Tunisia
-
 Turkey
-
 UAE
UAE
-
 Uganda
-
 Ukraine
-
 United Kingdom
-
United States
-
 Uruguay
-
 Uzbekistan
-
 Venezuela
-
 Vietnam
-
 Yemen
Yemen
-
 Zambia
-
 Zimbabwe
- Forex
- Crypto
