
Steady action for Tesco stock — sideways movement expected amid overbought signals

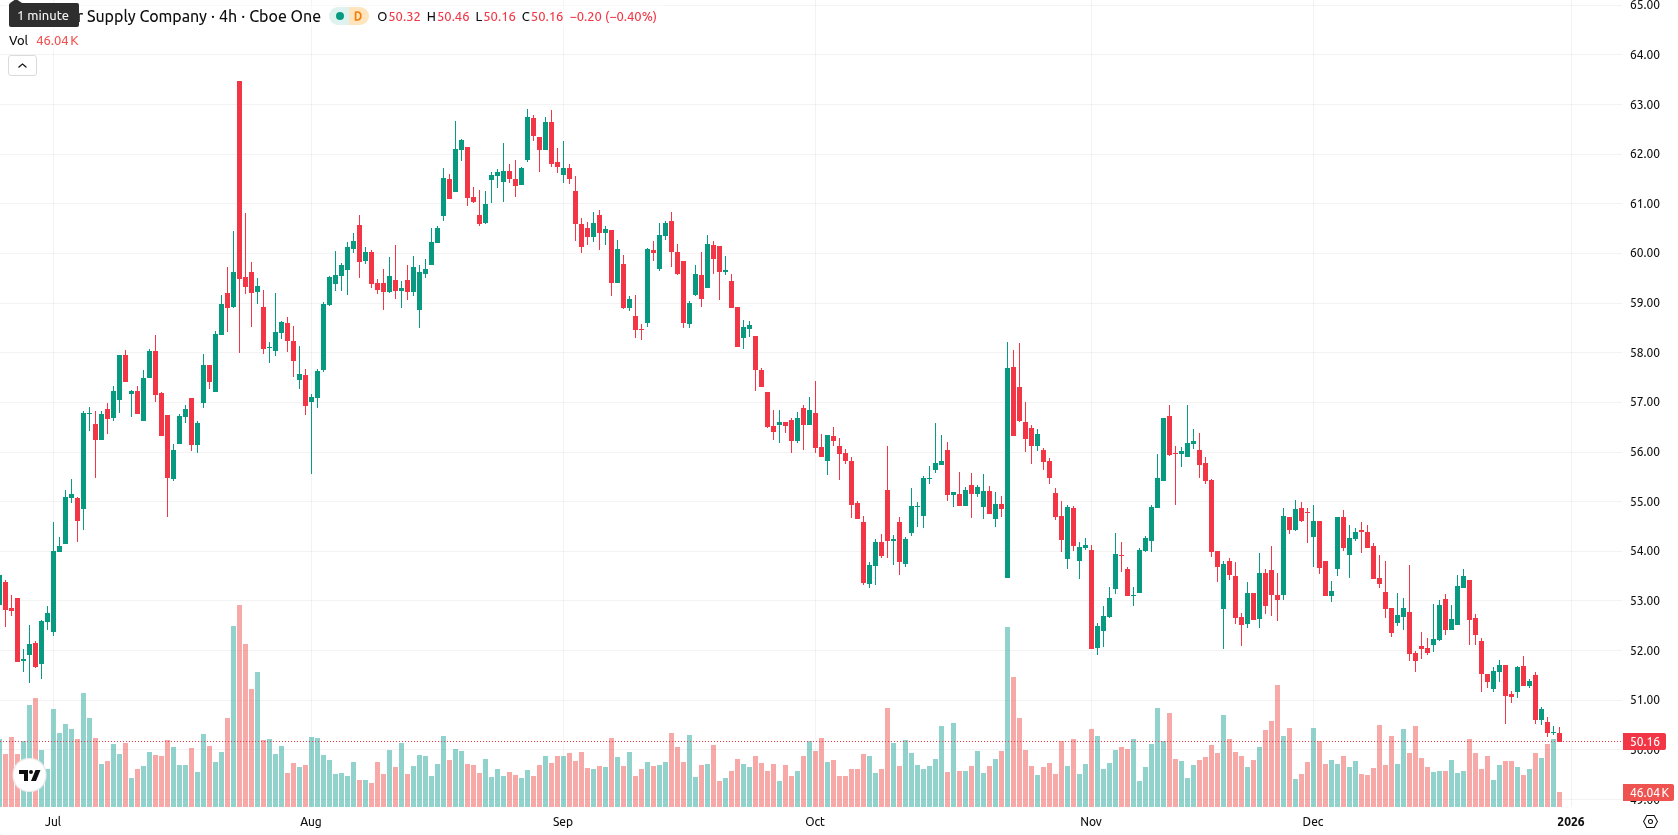
Tesco PLC (TSCO) is trading at GBX 441.80, with a daily movement of down GBX 1.80 or 0.41%. The price is positioned below the MA-20 (GBX 444.52) and MA-50 (GBX 450.03), but remains well above the MA-200 (GBX 410.66), indicating short- and medium-term selling pressure while the long-term trend is still supported.
Highlights
- Tesco continued its £1.45 billion share buyback programme by repurchasing and cancelling an additional 528,137 ordinary shares as part of capital allocation.
- The buyback indicates Tesco's confidence and financial strength, with industry observers viewing the ongoing action as a positive corporate signal.
- No other relevant corporate actions were reported for Tesco in this cycle, leaving the buyback as the primary market-moving event.
Share buyback expansion signals management confidence and capital strength
Tesco continued its £1.45 billion share buyback programme by repurchasing and cancelling an additional 528,137 ordinary shares as part of its capital allocation strategy. This ongoing action signals the company's confidence and financial strength, according to industry observers. No other relevant corporate actions were reported for Tesco in this cycle.
Mixed momentum and overbought signals fuel technical indecision
On the technical side, the nearest dynamic resistance is the Ichimoku Kijun level at GBX 446.20, while the MA-200 at GBX 410.66 provides key underlying support. Momentum indicators are mixed: MACD on D1 shows strong sell, ADX is neutral (indicating a lack of trend strength), RSI sits just below 50 with a bearish tilt, Stochastic RSI flags extreme overbought, and CCI is neutral. Bull/Bear Power (BBP) is overbought at 1.69, suggesting ongoing buyer dominance, despite today's modest price drop. The Awesome Oscillator is neutral, and Tesco is currently trading near the low of its daily range with low intraday volatility and a slight downside bias after a higher open. The conflicting momentum and overbought signals reflect indecision in the near-term market direction.
Limited downside risk as probability favors near-term range trading
For the next five trading days, the typical volatility band is expected to be between GBX 440.00 and GBX 445.00, centered around current levels. There is more than an 80% probability of a price increase, so extended downside appears less likely in the short term. The baseline scenario calls for sideways movement between support and resistance, with a potential bullish breakout above GBX 446.20. A bearish development could emerge if there is a sustained move below the GBX 440.00 level, which would bring the MA-200 at GBX 410.66 back into focus as longer-term support.
Previously it was reported that Tesco PLC is trading under both its short- and medium-term moving averages, reflecting mild selling pressure and mixed momentum indicators, while the longer-term uptrend persists above the 200-day average. The current technical setup suggests consolidation within a narrow range, with strong support near the 200-day moving average and key resistance just above current levels; a break higher could signal renewed bullish momentum.


-
 Afghanistan
-
 Albania
-
 Algeria
-
 Angola
-
 Argentina
-
 Armenia
-
 Australia
-
 Austria
-
 Azerbaijan
-
 Bahamas
-
 Bahrain
-
 Bangladesh
-
 Belarus
-
 Belgium
-
 Bolivia
-
 Botswana
-
 Brazil
-
 Brunei
-
 Bulgaria
-
 Cambodia
-
 Cameroon
-
 Canada
-
 Chile
Chile
-
 China
China
-
 Colombia
-
 Congo
Congo
-
 Costa Rica
-
 Cote d'Ivoire
-
 Croatia
-
 Cuba
Cuba
-
 Cyprus
-
 Czechia
-
 DR Congo
-
 Denmark
-
 Dominican Republic
-
 Ecuador
-
 Egypt
Egypt
-
 El Salvador
-
 Estonia
-
 Eswatini
-
 Ethiopia
-
 Finland
-
 France
-
 Georgia
-
 Germany
-
 Ghana
Ghana
-
 Greece
-
 Haiti
Haiti
-
 Hong Kong
-
 Hungary
-
 India
India
-
 Indonesia
-
 Iran, Islamic republic
-
 Iraq
Iraq
-
 Ireland
-
 Israel
-
 Italy
Italy
-
 Jamaica
-
 Japan
Japan
-
 Jordan
-
 Kazakhstan
-
 Kenya
Kenya
-
 Korea
Korea
-
 Kuwait
-
 Kyrgyzstan
-
 Laos
Laos
-
 Latvia
-
 Lebanon
-
 Lesotho
-
 Libya
Libya
-
 Lithuania
-
 Luxembourg
-
 Madagascar
-
 Malaysia
-
 Malta
Malta
-
 Mauritius
-
 Mexico
-
 Moldova
-
 Mongolia
-
 Montenegro
-
 Morocco
-
 Mozambique
-
 Myanmar
-
 Namibia
-
 Nepal
Nepal
-
 Netherlands
-
 New Zealand
-
 Nigeria
-
 North Macedonia
-
 Norway
-
 Oman
Oman
-
 Pakistan
-
 Palestine
-
 Panama
-
 Papua New Guinea
-
 Paraguay
-
 Peru
Peru
-
 Philippines
-
 Poland
-
 Portugal
-
 Puerto Rico
-
 Qatar
Qatar
-
 Reunion
-
 Romania
-
 Rwanda
-
 Saudi Arabia
-
 Serbia
-
 Singapore
-
 Slovakia
-
 Slovenia
-
 Somalia
-
 South Africa
-
 Spain
Spain
-
 Sri Lanka
-
 Sweden
-
 Switzerland
-
 Syria
Syria
-
 Taiwan
-
 Tajikistan
-
 Tanzania
-
 Thailand
-
 Trinidad and Tobago
-
 Tunisia
-
 Turkey
-
 UAE
UAE
-
 Uganda
-
 Ukraine
-
 United Kingdom
-
United States
-
 Uruguay
-
 Uzbekistan
-
 Venezuela
-
 Vietnam
-
 Yemen
Yemen
-
 Zambia
-
 Zimbabwe
- Forex
- Crypto
