
+3.13% for Globalstar stock — trading near highs with technical signals mixed

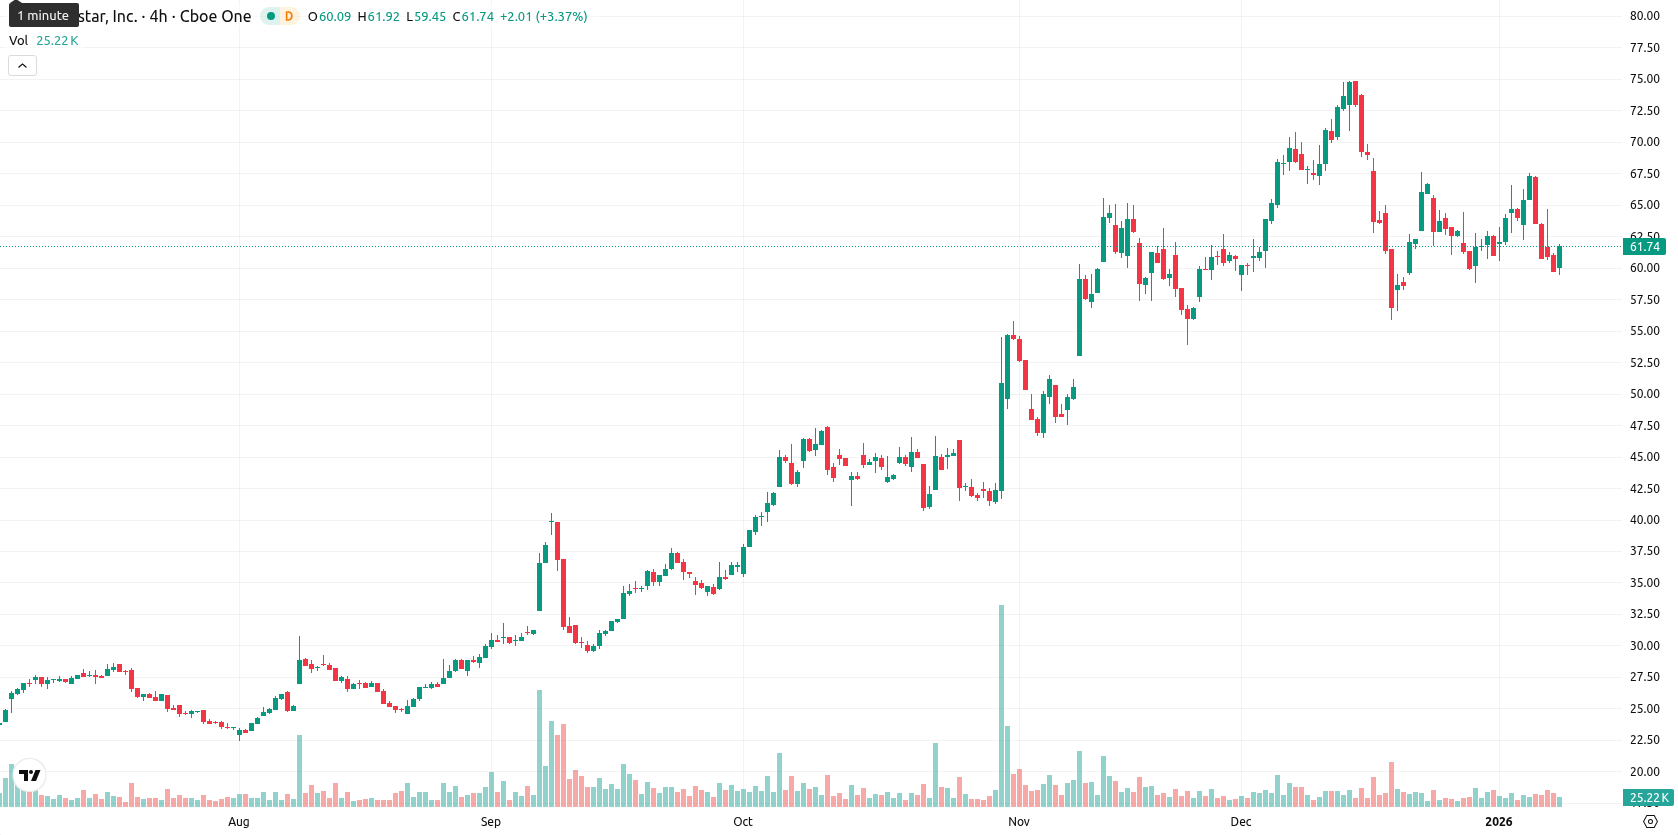
Globalstar, Inc. (GSAT) is trading at $61.63, positioning it below the MA-20 ($64.14) and just above the MA-50 ($60.42), with the MA-200 significantly lower at $35.22. This arrangement highlights short-term selling pressure, medium-term support, a bullish long-term trend, and the Ichimoku Kijun at $65.33 as nearby dynamic resistance.
Highlights
- Globalstar CEO Paul E. Jacobs sold 845 shares on January 7, 2026, signaling insider activity of note for equity holders.
- Globalstar completed a joint technology trial with Skydio, demonstrating Band n53 spectrum and XCOM RAN private 5G platform for alternative connectivity solutions.
- These developments support Globalstar's pursuit of broader 5G commercialization opportunities in the satellite connectivity sector.
Insider sales and tech trial advances shape 5G sentiment shift
Recent insider activity at Globalstar included CEO Paul E. Jacobs selling 845 shares on January 7, 2026. The company also completed a joint technology trial with Skydio, showcasing their Band n53 spectrum and XCOM RAN private 5G platform for alternative connectivity solutions. Both developments come as Globalstar pursues broader 5G commercialization opportunities within the satellite connectivity space.
Conflicting technical momentum as intraday buyers push session highs
The technical signals remain mixed for GSAT. The MACD on the daily timeframe gives a strong buy, but both RSI and Commodity Channel Index reflect selling pressure, while the Stochastic RSI is currently oversold. Bull/Bear Power is notably overbought, implying intraday buyer dominance even as other oscillators offer conflicting views. Technically, a small gap up occurred from yesterday’s close ($59.76) to today’s open ($60.63), with the current price near the top of today’s session range ($59.45 – $61.88), indicating moderate volatility and strength into session highs amid divergent short-term signals.
High upside probabilities as price volatility narrows near resistance
For the upcoming five trading days, the anticipated price volatility band for GSAT is set at $59.00 – $64.00, maintaining a slightly bullish slant given recent movement and ongoing volatility. The probability of a rise remains high (above 80%), while the likelihood of a meaningful drop is minimal. The most likely scenario is consolidation between $59.00 and $64.00. A sustained breakout above $64.00 could pave the way toward higher resistance levels, while a decisive close below $59.00 may lead to a short-term pullback.
Previously it was reported that Globalstar Inc is trading below its short- and medium-term moving averages but remains significantly above its long-term support level, reflecting current downside pressure amid an overall bullish long-term trend. Technical indicators are mixed with bullish MACD and Awesome Oscillator signals versus weakening momentum in RSI and Stochastic RSI, while price action is consolidating within a defined volatility band, raising the likelihood of a technical rebound.


Latest Globalstar News


-
 Afghanistan
-
 Albania
-
 Algeria
-
 Angola
-
 Argentina
-
 Armenia
-
 Australia
-
 Austria
-
 Azerbaijan
-
 Bahamas
-
 Bahrain
-
 Bangladesh
-
 Belarus
-
 Belgium
-
 Bolivia
-
 Botswana
-
 Brazil
-
 Brunei
-
 Bulgaria
-
 Cambodia
-
 Cameroon
-
 Canada
-
 Chile
Chile
-
 China
China
-
 Colombia
-
 Congo
Congo
-
 Costa Rica
-
 Cote d'Ivoire
-
 Croatia
-
 Cuba
Cuba
-
 Cyprus
-
 Czechia
-
 DR Congo
-
 Denmark
-
 Dominican Republic
-
 Ecuador
-
 Egypt
Egypt
-
 El Salvador
-
 Estonia
-
 Eswatini
-
 Ethiopia
-
 Finland
-
 France
-
 Georgia
-
 Germany
-
 Ghana
Ghana
-
 Greece
-
 Haiti
Haiti
-
 Hong Kong
-
 Hungary
-
 India
India
-
 Indonesia
-
 Iran, Islamic republic
-
 Iraq
Iraq
-
 Ireland
-
 Israel
-
 Italy
Italy
-
 Jamaica
-
 Japan
Japan
-
 Jordan
-
 Kazakhstan
-
 Kenya
Kenya
-
 Korea
Korea
-
 Kuwait
-
 Kyrgyzstan
-
 Laos
Laos
-
 Latvia
-
 Lebanon
-
 Lesotho
-
 Libya
Libya
-
 Lithuania
-
 Luxembourg
-
 Madagascar
-
 Malaysia
-
 Malta
Malta
-
 Mauritius
-
 Mexico
-
 Moldova
-
 Mongolia
-
 Montenegro
-
 Morocco
-
 Mozambique
-
 Myanmar
-
 Namibia
-
 Nepal
Nepal
-
 Netherlands
-
 New Zealand
-
 Nigeria
-
 North Macedonia
-
 Norway
-
 Oman
Oman
-
 Pakistan
-
 Palestine
-
 Panama
-
 Papua New Guinea
-
 Paraguay
-
 Peru
Peru
-
 Philippines
-
 Poland
-
 Portugal
-
 Puerto Rico
-
 Qatar
Qatar
-
 Reunion
-
 Romania
-
 Rwanda
-
 Saudi Arabia
-
 Serbia
-
 Singapore
-
 Slovakia
-
 Slovenia
-
 Somalia
-
 South Africa
-
 Spain
Spain
-
 Sri Lanka
-
 Sweden
-
 Switzerland
-
 Syria
Syria
-
 Taiwan
-
 Tajikistan
-
 Tanzania
-
 Thailand
-
 Trinidad and Tobago
-
 Tunisia
-
 Turkey
-
 UAE
UAE
-
 Uganda
-
 Ukraine
-
 United Kingdom
-
United States
-
 Uruguay
-
 Uzbekistan
-
 Venezuela
-
 Vietnam
-
 Yemen
Yemen
-
 Zambia
-
 Zimbabwe
- Forex
- Crypto
