
Consolidation for Costco stock — bullish momentum meets heightened profit-taking risk

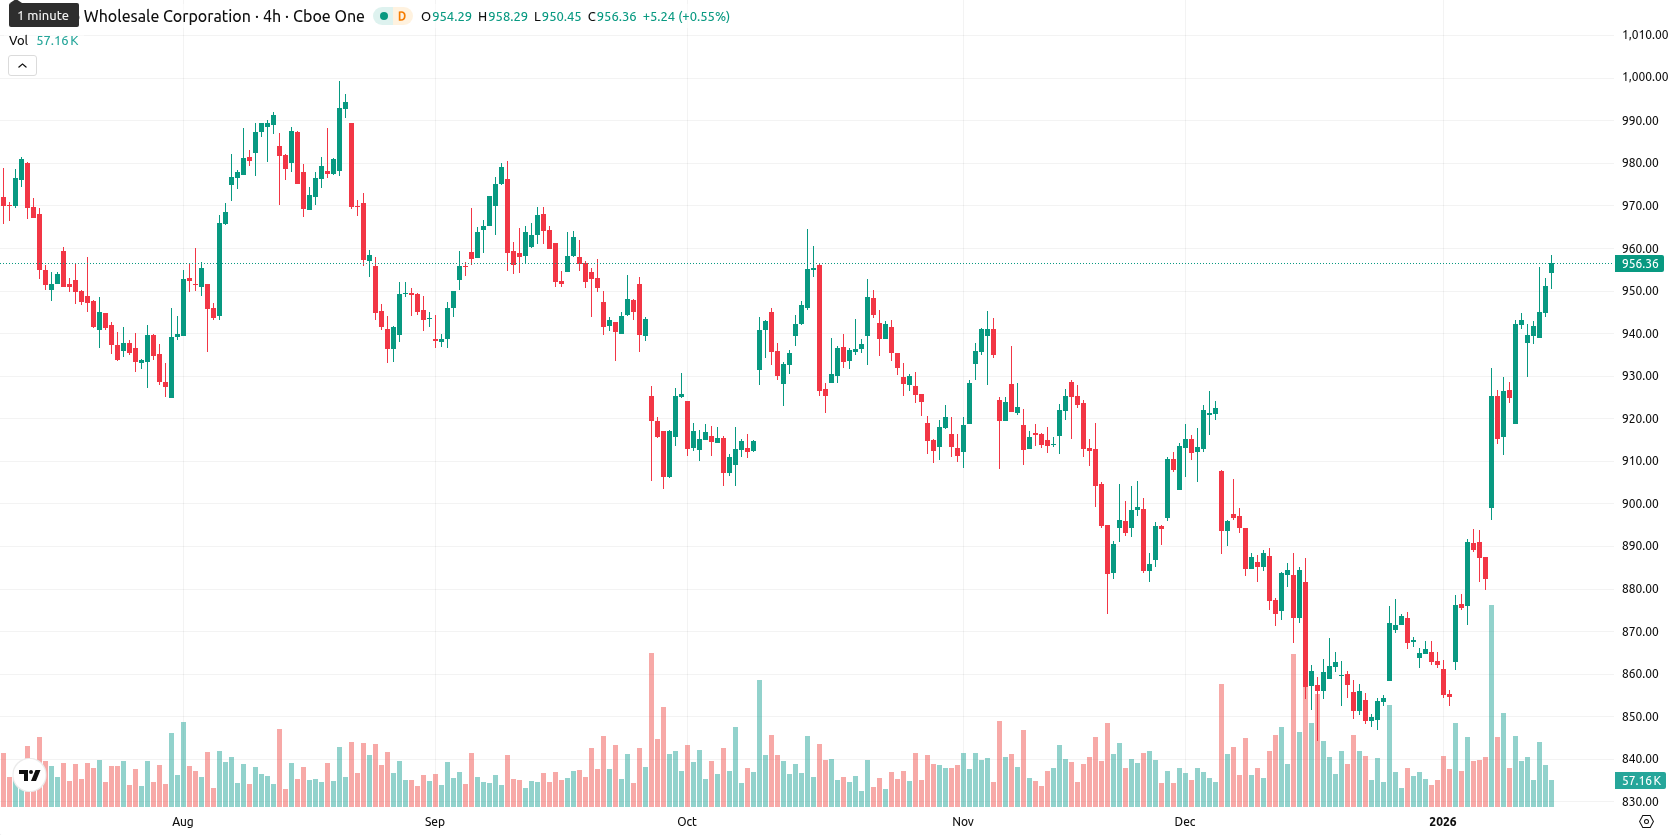
Costco Wholesale Corporation (COST) is trading at $957.21, well above its MA-20 ($883.06), MA-50 ($896.42), and MA-200 ($950.43), confirming short-, medium-, and long-term bullish trends. The Ichimoku Kijun offers dynamic support at $899.59, while the next significant resistance lies at the MA-50 or the round $960 level.
Highlights
- Costco reported quarterly earnings per share of $4.50 for Q1 2026, surpassing analysts’ expectations and reflecting strong financial performance.
- Several executives executed insider sales of company stock at the beginning of the year, exerting limited impact on Costco’s share price during the period.
- The company is rolling out changes to its checkout process, introducing enhanced technology and pilot programs to improve member efficiency.
Earnings beat, insider sales, and checkout upgrades drive sentiment
Costco recently reported quarterly earnings that exceeded analysts’ expectations, posting earnings per share of $4.50 for Q1 2026 and strong December sales results. Several executives disclosed insider sales of company stock at the beginning of the year, which had a limited impact on the stock during the period. The company is also implementing changes to its checkout process, including enhanced technology and pilot programs to improve efficiency for members.
Persistent momentum as overbought signals elevate correction risk
Momentum indicators show persistent upward pressure, with the MACD signaling a buy and the ADX at 20.97 indicating a developing trend. However, overbought signals are pronounced across RSI (71.94), Stochastic RSI (100.00), and CCI (174.14), while Bull/Bear Power at 47.48 confirms strong buyer dominance. The Awesome Oscillator also aligns with the prevailing bullish tone. COST opened slightly higher from the previous close, showing no significant gap, and is currently trading near today’s high, demonstrating low intraday volatility and early session strength toward the highs. Overall, there is a divergence between powerful momentum and clear overbought conditions, suggesting elevated risk of a short-term pause or pullback.
Downside bias as overbought status dampens upside prospects
For the coming five trading days, the expected range is $930 to $970, adjusted for recent volatility and the current price level. Based on the weekly technicals and momentum signals, there is a very low probability (less than 20%) of a price increase, making a decline more likely as overbought conditions weigh on the uptrend. The baseline scenario sees COST consolidating sideways within this corridor. A bullish scenario would require a decisive move above $960, opening room to new highs, while a bearish scenario unfolds if the price slips under $930, potentially triggering further profit-taking down to dynamic support near $900.
Last time, analysts noted that Costco was trading above its short- and medium-term moving averages with robust momentum indicators, but facing resistance just below its long-term average and signaling overbought conditions according to the RSI and other oscillators. The outlook anticipates consolidation within a defined range as both bullish momentum and overbought risks suggest limited directional conviction in the near term.


-
 Afghanistan
-
 Albania
-
 Algeria
-
 Angola
-
 Argentina
-
 Armenia
-
 Australia
-
 Austria
-
 Azerbaijan
-
 Bahamas
-
 Bahrain
-
 Bangladesh
-
 Belarus
-
 Belgium
-
 Bolivia
-
 Botswana
-
 Brazil
-
 Brunei
-
 Bulgaria
-
 Cambodia
-
 Cameroon
-
 Canada
-
 Chile
Chile
-
 China
China
-
 Colombia
-
 Congo
Congo
-
 Costa Rica
-
 Cote d'Ivoire
-
 Croatia
-
 Cuba
Cuba
-
 Cyprus
-
 Czechia
-
 DR Congo
-
 Denmark
-
 Dominican Republic
-
 Ecuador
-
 Egypt
Egypt
-
 El Salvador
-
 Estonia
-
 Eswatini
-
 Ethiopia
-
 Finland
-
 France
-
 Georgia
-
 Germany
-
 Ghana
Ghana
-
 Greece
-
 Haiti
Haiti
-
 Hong Kong
-
 Hungary
-
 India
India
-
 Indonesia
-
 Iran, Islamic republic
-
 Iraq
Iraq
-
 Ireland
-
 Israel
-
 Italy
Italy
-
 Jamaica
-
 Japan
Japan
-
 Jordan
-
 Kazakhstan
-
 Kenya
Kenya
-
 Korea
Korea
-
 Kuwait
-
 Kyrgyzstan
-
 Laos
Laos
-
 Latvia
-
 Lebanon
-
 Lesotho
-
 Libya
Libya
-
 Lithuania
-
 Luxembourg
-
 Madagascar
-
 Malaysia
-
 Malta
Malta
-
 Mauritius
-
 Mexico
-
 Moldova
-
 Mongolia
-
 Montenegro
-
 Morocco
-
 Mozambique
-
 Myanmar
-
 Namibia
-
 Nepal
Nepal
-
 Netherlands
-
 New Zealand
-
 Nigeria
-
 North Macedonia
-
 Norway
-
 Oman
Oman
-
 Pakistan
-
 Palestine
-
 Panama
-
 Papua New Guinea
-
 Paraguay
-
 Peru
Peru
-
 Philippines
-
 Poland
-
 Portugal
-
 Puerto Rico
-
 Qatar
Qatar
-
 Reunion
-
 Romania
-
 Rwanda
-
 Saudi Arabia
-
 Serbia
-
 Singapore
-
 Slovakia
-
 Slovenia
-
 Somalia
-
 South Africa
-
 Spain
Spain
-
 Sri Lanka
-
 Sweden
-
 Switzerland
-
 Syria
Syria
-
 Taiwan
-
 Tajikistan
-
 Tanzania
-
 Thailand
-
 Trinidad and Tobago
-
 Tunisia
-
 Turkey
-
 UAE
UAE
-
 Uganda
-
 Ukraine
-
 United Kingdom
-
United States
-
 Uruguay
-
 Uzbekistan
-
 Venezuela
-
 Vietnam
-
 Yemen
Yemen
-
 Zambia
-
 Zimbabwe
- Forex
- Crypto
