
Nano Dimension stock: technical resistance and muted trading drive slight decline

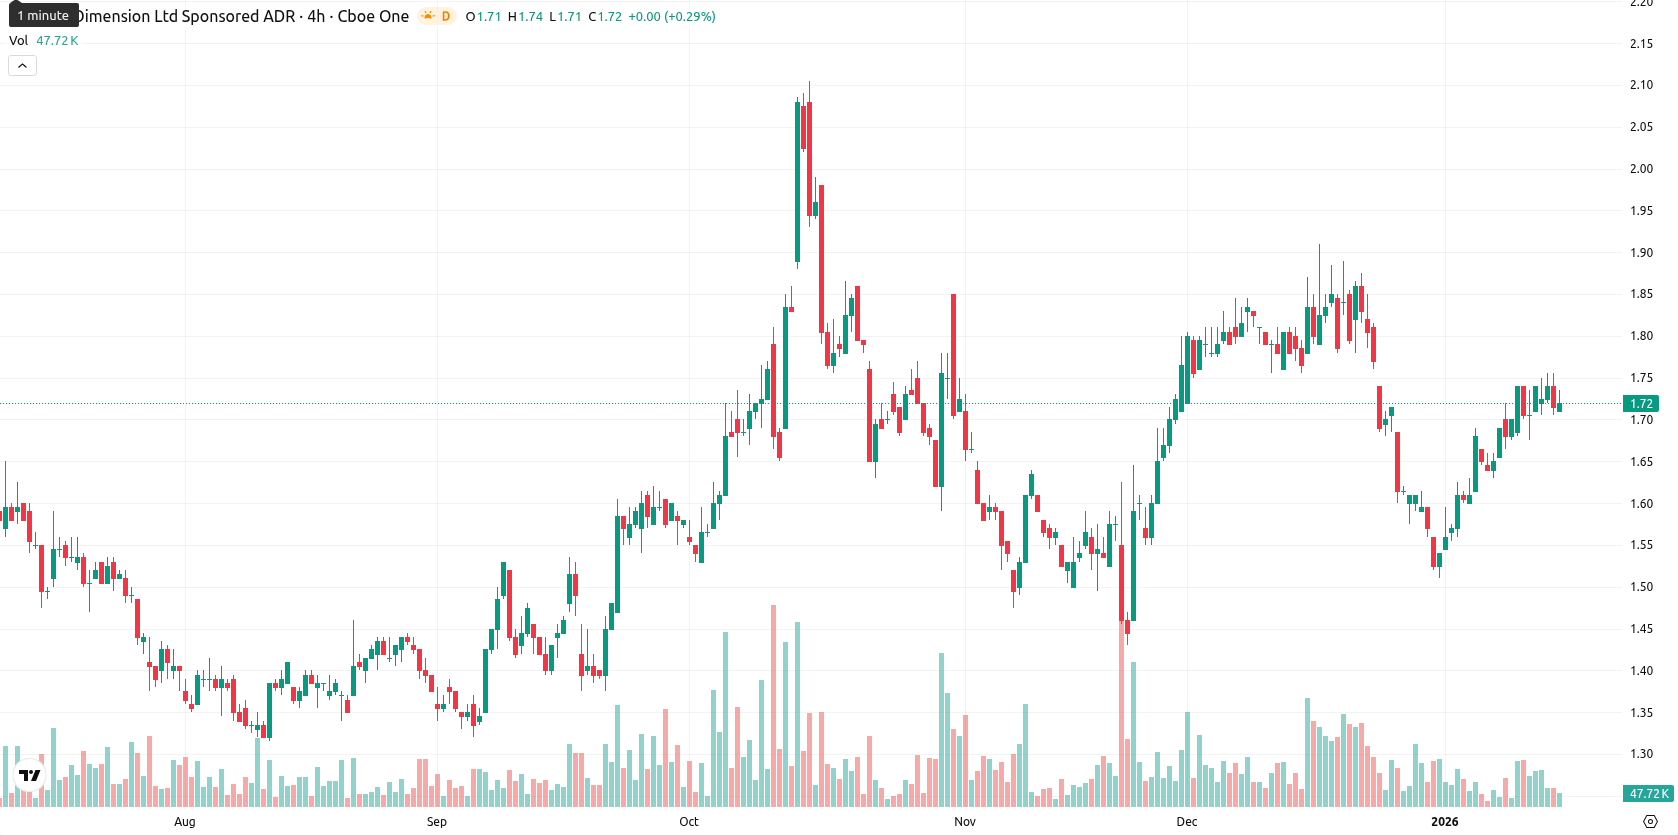
Nano Dimension Ltd (NNDM) is trading at $1.73, which is above its MA-20 ($1.68) and MA-50 ($1.67), indicating continued short- to medium-term bullish momentum. The price also remains well above the MA-200 ($1.57), supporting the long-term trend.
Highlights
- NNDM trades at $1.73, above its MA-20 ($1.68), MA-50 ($1.67), and MA-200 ($1.57), signaling ongoing bullish momentum across all timeframes.
- Momentum indicators are mixed with a neutral MACD and ADX, a moderately bullish RSI at 54.84, and an overbought Stochastic RSI at 96.93 indicating possible short-term consolidation.
- For the next five days, the expected trading range is $1.70–$1.80, with key support at $1.72 (Ichimoku Kijun) and resistance near $1.75–$1.76.
Muted session as mixed momentum signals meet key MA boundaries
The nearest dynamic support is located at the Ichimoku Kijun ($1.72), with immediate resistance at the MA-50 and the round number $1.75. Momentum signals are mixed: MACD and ADX are neutral on the daily, RSI is moderately bullish at 54.84, while Stochastic RSI is overbought (96.93) and CCI is neutral. Bull/Bear Power indicates moderate intraday accumulation, but today’s price action has been muted with the current price sitting mid-range in today’s $1.70 – $1.76 band amid low volatility and mild downward pressure after the open.
Sideways range expected as breakout risks limit near-term direction
Over the next five trading days, the expected price range is $1.70 to $1.80, consistent with a typical volatility band relative to current levels. The probability of a move higher is moderate at 50%, while a further decline appears less likely. The base scenario points to sideways action between support at $1.72 and resistance at $1.75 – $1.76, with a breakout above $1.76 targeting $1.80, and a close below $1.72 exposing $1.70.
Last time, analysts noted that Nano Dimension Ltd was holding above key moving averages, indicating a bullish bias, but momentum indicators such as MACD and Stochastic RSI signaled mixed short-term strength and possible overbought conditions. The stock was consolidating with support at $1.72 and resistance near $1.76, suggesting a likely continuation of sideways trading within a defined volatility band barring a decisive breakout.


Latest Nano Dimension News


-
 Afghanistan
-
 Albania
-
 Algeria
-
 Angola
-
 Argentina
-
 Armenia
-
 Australia
-
 Austria
-
 Azerbaijan
-
 Bahamas
-
 Bahrain
-
 Bangladesh
-
 Belarus
-
 Belgium
-
 Bolivia
-
 Botswana
-
 Brazil
-
 Brunei
-
 Bulgaria
-
 Cambodia
-
 Cameroon
-
 Canada
-
 Chile
Chile
-
 China
China
-
 Colombia
-
 Congo
Congo
-
 Costa Rica
-
 Cote d'Ivoire
-
 Croatia
-
 Cuba
Cuba
-
 Cyprus
-
 Czechia
-
 DR Congo
-
 Denmark
-
 Dominican Republic
-
 Ecuador
-
 Egypt
Egypt
-
 El Salvador
-
 Estonia
-
 Eswatini
-
 Ethiopia
-
 Finland
-
 France
-
 Georgia
-
 Germany
-
 Ghana
Ghana
-
 Greece
-
 Haiti
Haiti
-
 Hong Kong
-
 Hungary
-
 India
India
-
 Indonesia
-
 Iran, Islamic republic
-
 Iraq
Iraq
-
 Ireland
-
 Israel
-
 Italy
Italy
-
 Jamaica
-
 Japan
Japan
-
 Jordan
-
 Kazakhstan
-
 Kenya
Kenya
-
 Korea
Korea
-
 Kuwait
-
 Kyrgyzstan
-
 Laos
Laos
-
 Latvia
-
 Lebanon
-
 Lesotho
-
 Libya
Libya
-
 Lithuania
-
 Luxembourg
-
 Madagascar
-
 Malaysia
-
 Malta
Malta
-
 Mauritius
-
 Mexico
-
 Moldova
-
 Mongolia
-
 Montenegro
-
 Morocco
-
 Mozambique
-
 Myanmar
-
 Namibia
-
 Nepal
Nepal
-
 Netherlands
-
 New Zealand
-
 Nigeria
-
 North Macedonia
-
 Norway
-
 Oman
Oman
-
 Pakistan
-
 Palestine
-
 Panama
-
 Papua New Guinea
-
 Paraguay
-
 Peru
Peru
-
 Philippines
-
 Poland
-
 Portugal
-
 Puerto Rico
-
 Qatar
Qatar
-
 Reunion
-
 Romania
-
 Rwanda
-
 Saudi Arabia
-
 Serbia
-
 Singapore
-
 Slovakia
-
 Slovenia
-
 Somalia
-
 South Africa
-
 Spain
Spain
-
 Sri Lanka
-
 Sweden
-
 Switzerland
-
 Syria
Syria
-
 Taiwan
-
 Tajikistan
-
 Tanzania
-
 Thailand
-
 Trinidad and Tobago
-
 Tunisia
-
 Turkey
-
 UAE
UAE
-
 Uganda
-
 Ukraine
-
 United Kingdom
-
United States
-
 Uruguay
-
 Uzbekistan
-
 Venezuela
-
 Vietnam
-
 Yemen
Yemen
-
 Zambia
-
 Zimbabwe
- Forex
- Crypto
