
+5.70% for Hut 8 stock — strong intraday buying pushes price near resistance

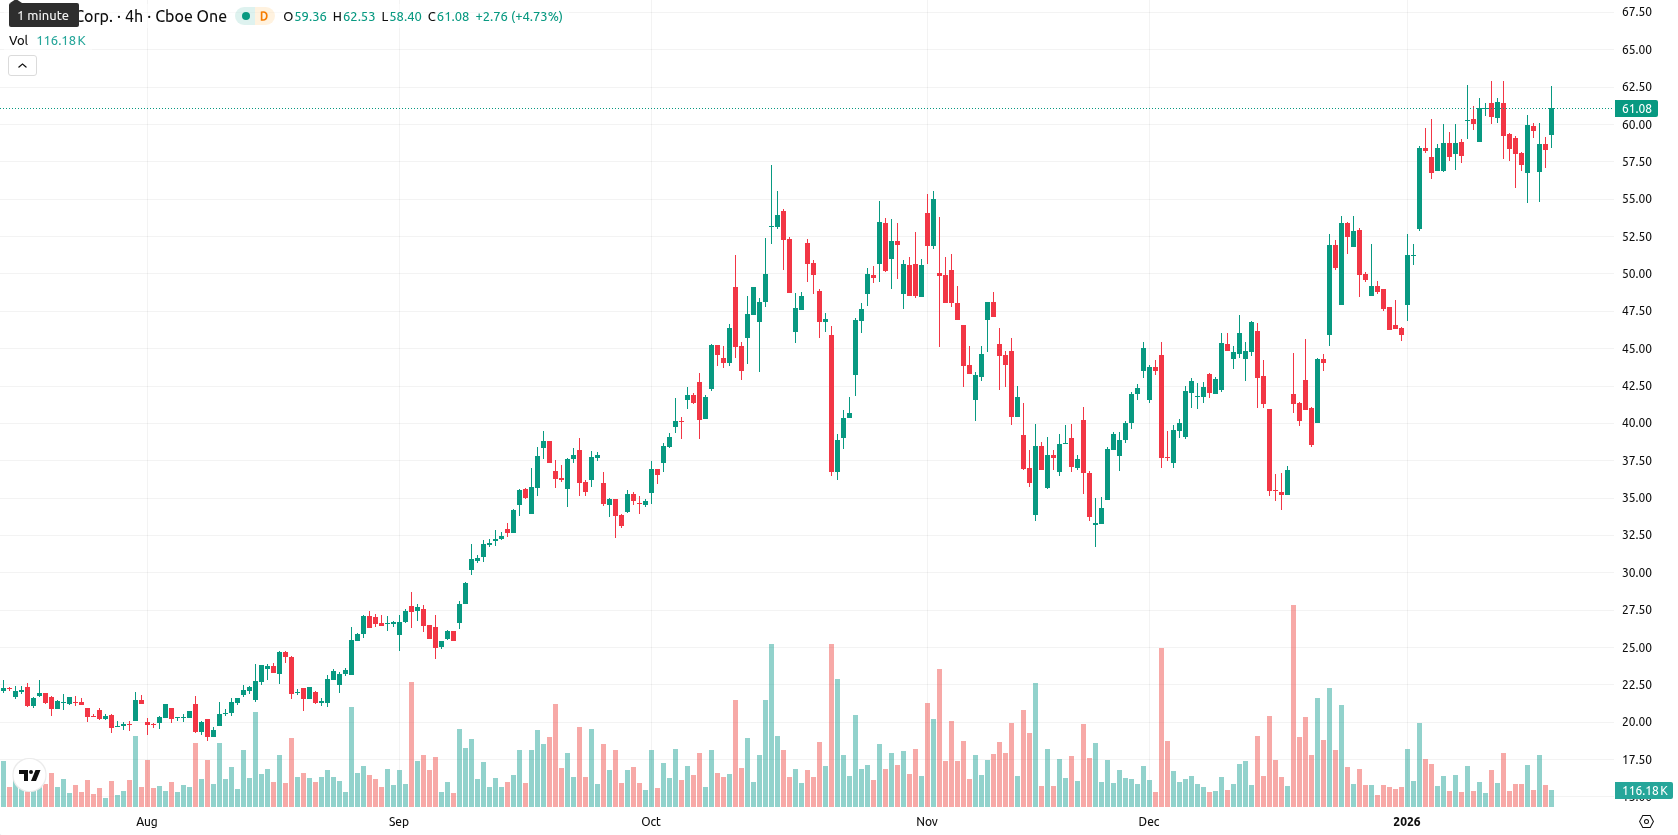
Hut 8 Corp (HUT) is trading at $61.61, having broken well above the MA-20 at $54.52, MA-50 at $46.24, and MA-200 at $30.23. This configuration highlights strong bullish momentum across both the short and long term, with immediate dynamic support located at the Ichimoku Kijun level of $48.55 and the next resistance anticipated near $65.00.
Highlights
- Hut 8 surged to $61.61, decisively above the MA-20 at $54.52, MA-50 at $46.24, and MA-200 at $30.23, signaling strong bullish momentum.
- Momentum indicators are bullish with D1 MACD showing 'Strong Buy' and RSI elevated but not overbought, while Stochastic RSI and CCI indicate short-term overheating risk.
- For the next five trading days, Hut 8 is forecast to consolidate between $58.00 support and $68.00 resistance, with an 80%+ probability of further price gains.
Buy signals and overbought risks amid strong intraday demand
Momentum indicators remain strong, with the D1 MACD giving a 'Strong Buy' reading and the ADX holding neutral. The RSI is in bullish territory but has not yet entered the overbought zone, while Stochastic RSI, CCI, and Bull/Bear Power point to some overbought conditions and clear buyer dominance, indicating strong intraday performance but a risk of short-term overheating. The Awesome Oscillator remains neutral, in line with the prevailing uptrend. Today's session opened with a minor upward gap, and the asset is now near the top of its daily range amid heightened intraday volatility — underscoring continued buying pressure yet some divergence in short-term risk signals.
Upward bias holds as price consolidates near high-volatility range
For the next five trading days, the typical volatility band for Hut 8 is expected between $58.00 and $68.00, reflecting more than an 80% chance of further price gains as weekly indicators signal persistent upward momentum. The baseline scenario sees the price consolidating sideways within a $58.00 support and $68.00 resistance range. A bullish case could materialize if Hut 8 breaks decisively above $68.00 on strong buying momentum and volume, while a bearish scenario would only develop if there is a significant move below $58.00, shifting the short-term focus toward lower support levels.
Previously it was reported that Hut 8 Corp. is trading strongly above all major moving averages, reflecting continued bullish sentiment while approaching significant resistance near $65.00. Despite optimistic signals from the MACD and RSI, overbought oscillator levels and mixed momentum indicators highlight rising volatility and the potential for a near-term pullback.


Latest Hut 8 News


-
 Afghanistan
-
 Albania
-
 Algeria
-
 Angola
-
 Argentina
-
 Armenia
-
 Australia
-
 Austria
-
 Azerbaijan
-
 Bahamas
-
 Bahrain
-
 Bangladesh
-
 Belarus
-
 Belgium
-
 Bolivia
-
 Botswana
-
 Brazil
-
 Brunei
-
 Bulgaria
-
 Cambodia
-
 Cameroon
-
 Canada
-
 Chile
Chile
-
 China
China
-
 Colombia
-
 Congo
Congo
-
 Costa Rica
-
 Cote d'Ivoire
-
 Croatia
-
 Cuba
Cuba
-
 Cyprus
-
 Czechia
-
 DR Congo
-
 Denmark
-
 Dominican Republic
-
 Ecuador
-
 Egypt
Egypt
-
 El Salvador
-
 Estonia
-
 Eswatini
-
 Ethiopia
-
 Finland
-
 France
-
 Georgia
-
 Germany
-
 Ghana
Ghana
-
 Greece
-
 Haiti
Haiti
-
 Hong Kong
-
 Hungary
-
 India
India
-
 Indonesia
-
 Iran, Islamic republic
-
 Iraq
Iraq
-
 Ireland
-
 Israel
-
 Italy
Italy
-
 Jamaica
-
 Japan
Japan
-
 Jordan
-
 Kazakhstan
-
 Kenya
Kenya
-
 Korea
Korea
-
 Kuwait
-
 Kyrgyzstan
-
 Laos
Laos
-
 Latvia
-
 Lebanon
-
 Lesotho
-
 Libya
Libya
-
 Lithuania
-
 Luxembourg
-
 Madagascar
-
 Malaysia
-
 Malta
Malta
-
 Mauritius
-
 Mexico
-
 Moldova
-
 Mongolia
-
 Montenegro
-
 Morocco
-
 Mozambique
-
 Myanmar
-
 Namibia
-
 Nepal
Nepal
-
 Netherlands
-
 New Zealand
-
 Nigeria
-
 North Macedonia
-
 Norway
-
 Oman
Oman
-
 Pakistan
-
 Palestine
-
 Panama
-
 Papua New Guinea
-
 Paraguay
-
 Peru
Peru
-
 Philippines
-
 Poland
-
 Portugal
-
 Puerto Rico
-
 Qatar
Qatar
-
 Reunion
-
 Romania
-
 Rwanda
-
 Saudi Arabia
-
 Serbia
-
 Singapore
-
 Slovakia
-
 Slovenia
-
 Somalia
-
 South Africa
-
 Spain
Spain
-
 Sri Lanka
-
 Sweden
-
 Switzerland
-
 Syria
Syria
-
 Taiwan
-
 Tajikistan
-
 Tanzania
-
 Thailand
-
 Trinidad and Tobago
-
 Tunisia
-
 Turkey
-
 UAE
UAE
-
 Uganda
-
 Ukraine
-
 United Kingdom
-
United States
-
 Uruguay
-
 Uzbekistan
-
 Venezuela
-
 Vietnam
-
 Yemen
Yemen
-
 Zambia
-
 Zimbabwe
- Forex
- Crypto
