
JetBlue Airways stock: Momentum divergence triggers a daily 3.5% loss

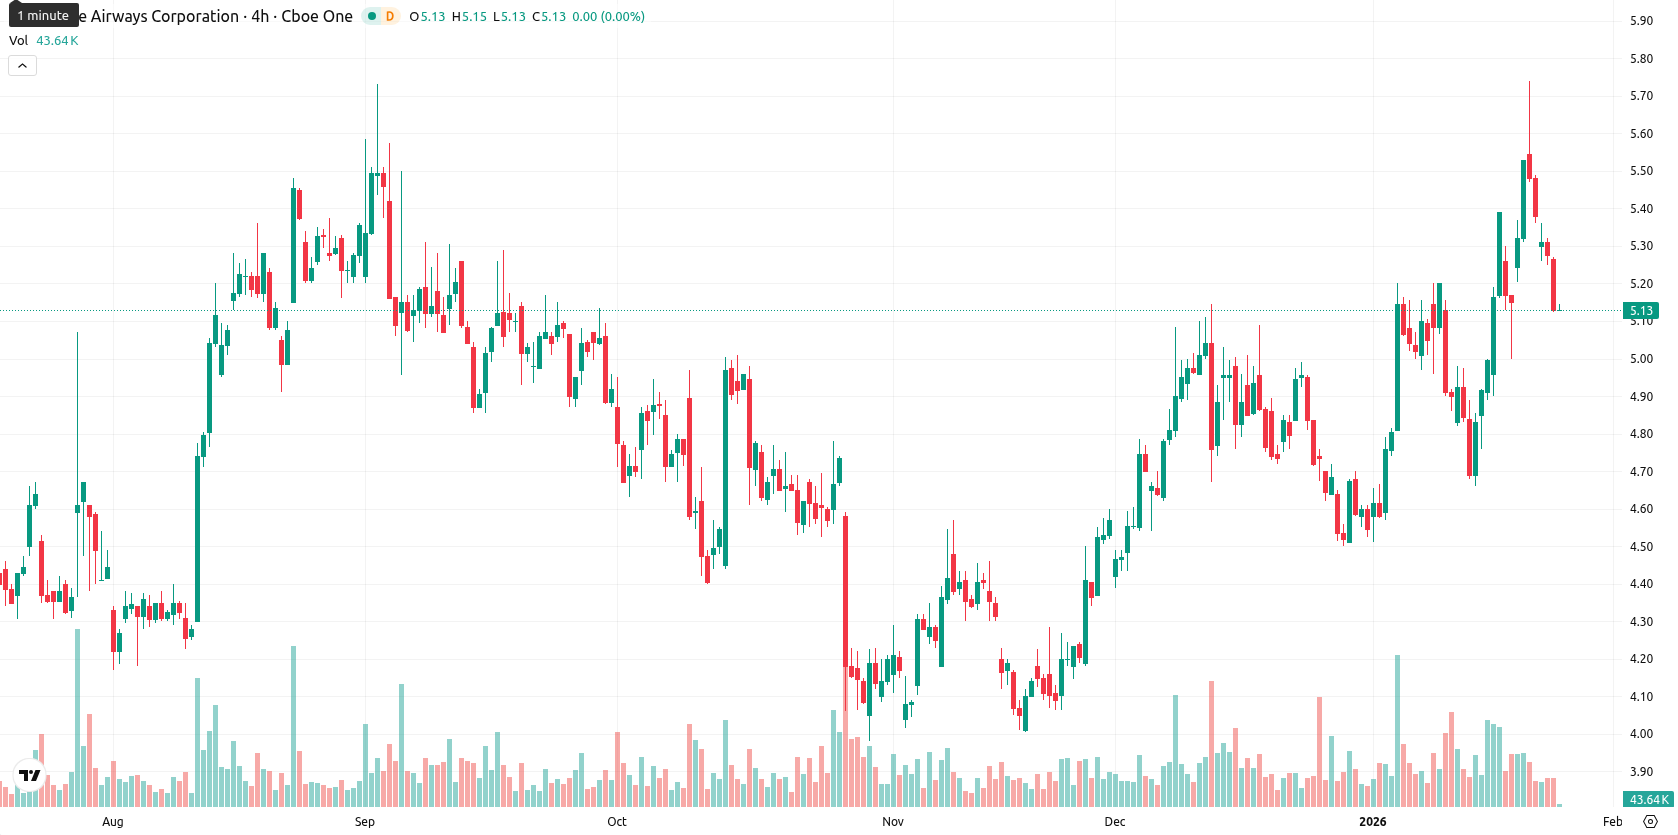
JetBlue Airways Corp (JBLU) is trading at $5.10, currently above its MA-20 ($4.96), MA-50 ($4.73), and MA-200 ($4.65), reinforcing a bullish structure across the short, medium, and long-term trends. The nearest dynamic support is at the Ichimoku Kijun level of $5.13, just above the current price, while resistance may be found near the MA-50 or at the next round level, with no golden cross or death cross signals present.
Highlights
- JetBlue Airways (JBLU) trades at $5.10, holding above its MA-20 ($4.96), MA-50 ($4.73), and MA-200 ($4.65), indicating a bullish trend across timeframes.
- Near-term support sits at the Ichimoku Kijun level of $5.13, with daily momentum positive despite a 3.50% decline today and sellers pressuring the lower end of the session range.
- JBLU is anticipated to trade sideways to upward in a $4.95–$5.20 corridor over the next five trading days, with a break above $5.20 targeting $5.30.
Positive momentum diverges from intraday weakness as sellers emerge
Momentum signals on the daily chart show a moderate positive bias, with the MACD indicating a buy and the ADX remaining in neutral territory. The RSI is in the buy zone but not overbought, and the Stochastic RSI and CCI are neutral, suggesting the market is not stretched in either direction. Bull/Bear Power is positive, indicating marginal buyer dominance; the Awesome Oscillator also aligns with the upward trend. Today, the price slipped 3.50%, opening at $5.25 (narrow gap from the previous close of $5.28) and is presently trading near the lower end of today's range ($5.13 – $5.25), with volatility subdued and sellers exerting pressure after the open. While most momentum signals are constructive, intraday tone and several oscillators highlight short-term weakness, creating a mild divergence between daily trend and immediate price action.
Sideways to upward bias as volatility and indicators limit downside risk
Looking ahead to the next five trading days, the anticipated price range is $4.95 to $5.20, adjusted to remain within a typical volatility band relative to current levels. Based on indicator consensus — with three out of four weekly signals tilted positive — there is a high probability (more than 80%) of sideways to upward movement, with a downward break less likely. In the baseline scenario, JBLU trades sideways in the $4.95 – $5.20 corridor, supported by stable momentum and neutral volatility. In a bullish case, a sustained move above $5.20 could trigger a run toward $5.30. A bearish break beneath $4.95 support may invite further selling, but indicators suggest this is a less probable scenario for the coming week.
Previously it was reported that JetBlue Airways Corp. shares are maintaining a bullish trend above key moving averages, with momentum indicators such as MACD and RSI remaining positive while some oscillators signal near-term overbought conditions. Dynamic support is observed around the Ichimoku Kijun, while resistance approaches the psychological $5.50 level amid ongoing institutional interest and elevated intraday buying activity.


Latest JetBlue News


-
 Afghanistan
-
 Albania
-
 Algeria
-
 Angola
-
 Argentina
-
 Armenia
-
 Australia
-
 Austria
-
 Azerbaijan
-
 Bahamas
-
 Bahrain
-
 Bangladesh
-
 Belarus
-
 Belgium
-
 Bolivia
-
 Botswana
-
 Brazil
-
 Brunei
-
 Bulgaria
-
 Cambodia
-
 Cameroon
-
 Canada
-
 Chile
Chile
-
 China
China
-
 Colombia
-
 Congo
Congo
-
 Costa Rica
-
 Cote d'Ivoire
-
 Croatia
-
 Cuba
Cuba
-
 Cyprus
-
 Czechia
-
 DR Congo
-
 Denmark
-
 Dominican Republic
-
 Ecuador
-
 Egypt
Egypt
-
 El Salvador
-
 Estonia
-
 Eswatini
-
 Ethiopia
-
 Finland
-
 France
-
 Georgia
-
 Germany
-
 Ghana
Ghana
-
 Greece
-
 Haiti
Haiti
-
 Hong Kong
-
 Hungary
-
 India
India
-
 Indonesia
-
 Iran, Islamic republic
-
 Iraq
Iraq
-
 Ireland
-
 Israel
-
 Italy
Italy
-
 Jamaica
-
 Japan
Japan
-
 Jordan
-
 Kazakhstan
-
 Kenya
Kenya
-
 Korea
Korea
-
 Kuwait
-
 Kyrgyzstan
-
 Laos
Laos
-
 Latvia
-
 Lebanon
-
 Lesotho
-
 Libya
Libya
-
 Lithuania
-
 Luxembourg
-
 Madagascar
-
 Malaysia
-
 Malta
Malta
-
 Mauritius
-
 Mexico
-
 Moldova
-
 Mongolia
-
 Montenegro
-
 Morocco
-
 Mozambique
-
 Myanmar
-
 Namibia
-
 Nepal
Nepal
-
 Netherlands
-
 New Zealand
-
 Nigeria
-
 North Macedonia
-
 Norway
-
 Oman
Oman
-
 Pakistan
-
 Palestine
-
 Panama
-
 Papua New Guinea
-
 Paraguay
-
 Peru
Peru
-
 Philippines
-
 Poland
-
 Portugal
-
 Puerto Rico
-
 Qatar
Qatar
-
 Reunion
-
 Romania
-
 Rwanda
-
 Saudi Arabia
-
 Serbia
-
 Singapore
-
 Slovakia
-
 Slovenia
-
 Somalia
-
 South Africa
-
 Spain
Spain
-
 Sri Lanka
-
 Sweden
-
 Switzerland
-
 Syria
Syria
-
 Taiwan
-
 Tajikistan
-
 Tanzania
-
 Thailand
-
 Trinidad and Tobago
-
 Tunisia
-
 Turkey
-
 UAE
UAE
-
 Uganda
-
 Ukraine
-
 United Kingdom
-
United States
-
 Uruguay
-
 Uzbekistan
-
 Venezuela
-
 Vietnam
-
 Yemen
Yemen
-
 Zambia
-
 Zimbabwe
- Forex
- Crypto
