
Persistent selling pressure and bearish signals — Intuit stock falls 3.68%

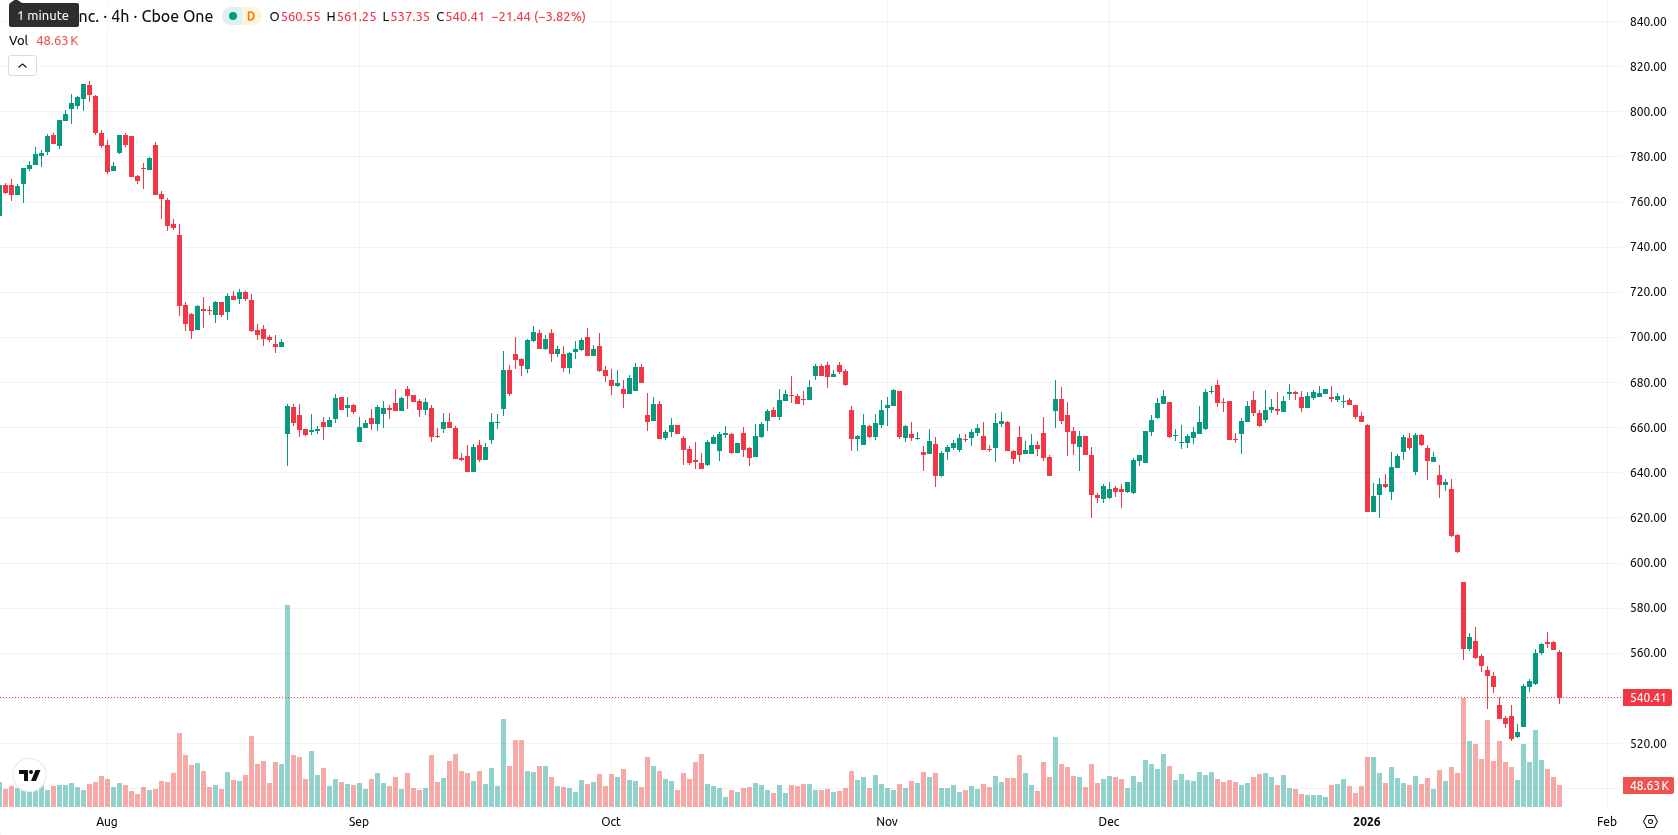
Intuit Inc. (INTU) is trading well below all major moving averages, with the latest price at $541.08, down 3.68% from the previous close. The asset remains beneath its MA-20 at $608.93, MA-50 at $637.68, and MA-200 at $681.93, signaling persistent bearish momentum across short, medium, and long-term timeframes.
Highlights
- INTU is trading at $541.08, significantly below its MA-20 ($608.93), MA-50 ($637.68), and MA-200 ($681.93), indicating clear bearish pressure across all timeframes.
- Momentum remains strongly negative with MACD, ADX, and RSI (35.41) confirming persistent selling, while the price dropped 3.68% from the previous close amid high volatility.
- Expected five-day price range is $525–$555, with a more than 80% probability of further downside; a break below $525 could target $510.
Board approvals and new partnerships as diversity push stalls
Intuit's board approved an amended compensation program for non-employee directors effective January 22, 2026, and shareholders re-elected eleven directors, approved executive compensation, and ratified Ernst & Young LLP as independent auditor for the fiscal year ending July 31, 2026. A shareholder proposal regarding diversity and inclusion reporting was not approved. The company also announced new strategic partnerships with BDO Canada and Checkr to expand integrated offerings for small and mid-sized businesses.
Bearish momentum confirmed as technical signals show seller dominance
INTU is currently trading well below all major Moving Averages, with the price at $541.08 under the MA-20 at $608.93, MA-50 at $637.68, and MA-200 at $681.93, pointing to clear short-, medium-, and long-term bearish pressure. The closest dynamic resistance is at the Ichimoku Kijun level of $599.98, while recent weakness confirms sustained downward momentum with sellers firmly in control. Momentum signals remain negative, as the MACD and ADX both indicate selling pressure, while the RSI at 35.41 and Commodity Channel Index at -63.28 approach oversold territory. Stochastic RSI is neutral but fluctuates between oversold and overbought conditions across intraday timeframes. Bull/Bear Power shows a strong oversold reading at -8.43, highlighting dominant selling activity throughout the session. The Awesome Oscillator is neutral on the daily, and price action reflects a drop of 3.68% from the previous close, with no gap at the open. The current price is near today’s low within the intraday range, suggesting high volatility and consistent downward pressure after the open. There is little divergence as both oscillators and momentum indicators broadly point to ongoing seller dominance.
Sideways consolidation likely as downside risk remains elevated
For the next five trading days, the adjusted expected price range is likely between $525 and $555, in line with typical volatility for INTU. The probability of a further price decrease is very high (more than 80%), while an advance above recent levels appears less likely. The baseline scenario calls for sideways consolidation between $525 and $555 as sellers look to defend lower support. A bullish scenario would require a break above $555, targeting $570, but the technical backdrop makes this unlikely short term. Conversely, if $525 fails, a bearish extension toward $510 is probable, with persistent momentum signals and dominant sellers reinforcing the downside risk.
Previously it was reported that Intuit Inc. continues to trade well below its key moving averages across all primary time frames, with bearish momentum persisting as highlighted by oversold readings from the RSI and negative MACD signals. Support remains at $540.00 and resistance at $560.00, with the asset expected to move sideways in this range absent a clear reversal catalyst.


-
 Afghanistan
-
 Albania
-
 Algeria
-
 Angola
-
 Argentina
-
 Armenia
-
 Australia
-
 Austria
-
 Azerbaijan
-
 Bahamas
-
 Bahrain
-
 Bangladesh
-
 Belarus
-
 Belgium
-
 Bolivia
-
 Botswana
-
 Brazil
-
 Brunei
-
 Bulgaria
-
 Cambodia
-
 Cameroon
-
 Canada
-
 Chile
Chile
-
 China
China
-
 Colombia
-
 Congo
Congo
-
 Costa Rica
-
 Cote d'Ivoire
-
 Croatia
-
 Cuba
Cuba
-
 Cyprus
-
 Czechia
-
 DR Congo
-
 Denmark
-
 Dominican Republic
-
 Ecuador
-
 Egypt
Egypt
-
 El Salvador
-
 Estonia
-
 Eswatini
-
 Ethiopia
-
 Finland
-
 France
-
 Georgia
-
 Germany
-
 Ghana
Ghana
-
 Greece
-
 Haiti
Haiti
-
 Hong Kong
-
 Hungary
-
 India
India
-
 Indonesia
-
 Iran, Islamic republic
-
 Iraq
Iraq
-
 Ireland
-
 Israel
-
 Italy
Italy
-
 Jamaica
-
 Japan
Japan
-
 Jordan
-
 Kazakhstan
-
 Kenya
Kenya
-
 Korea
Korea
-
 Kuwait
-
 Kyrgyzstan
-
 Laos
Laos
-
 Latvia
-
 Lebanon
-
 Lesotho
-
 Libya
Libya
-
 Lithuania
-
 Luxembourg
-
 Madagascar
-
 Malaysia
-
 Malta
Malta
-
 Mauritius
-
 Mexico
-
 Moldova
-
 Mongolia
-
 Montenegro
-
 Morocco
-
 Mozambique
-
 Myanmar
-
 Namibia
-
 Nepal
Nepal
-
 Netherlands
-
 New Zealand
-
 Nigeria
-
 North Macedonia
-
 Norway
-
 Oman
Oman
-
 Pakistan
-
 Palestine
-
 Panama
-
 Papua New Guinea
-
 Paraguay
-
 Peru
Peru
-
 Philippines
-
 Poland
-
 Portugal
-
 Puerto Rico
-
 Qatar
Qatar
-
 Reunion
-
 Romania
-
 Rwanda
-
 Saudi Arabia
-
 Serbia
-
 Singapore
-
 Slovakia
-
 Slovenia
-
 Somalia
-
 South Africa
-
 Spain
Spain
-
 Sri Lanka
-
 Sweden
-
 Switzerland
-
 Syria
Syria
-
 Taiwan
-
 Tajikistan
-
 Tanzania
-
 Thailand
-
 Trinidad and Tobago
-
 Tunisia
-
 Turkey
-
 UAE
UAE
-
 Uganda
-
 Ukraine
-
 United Kingdom
-
United States
-
 Uruguay
-
 Uzbekistan
-
 Venezuela
-
 Vietnam
-
 Yemen
Yemen
-
 Zambia
-
 Zimbabwe
- Forex
- Crypto
