
COST weekly outlook: slips 2.3% but holds above all major weekly moving averages

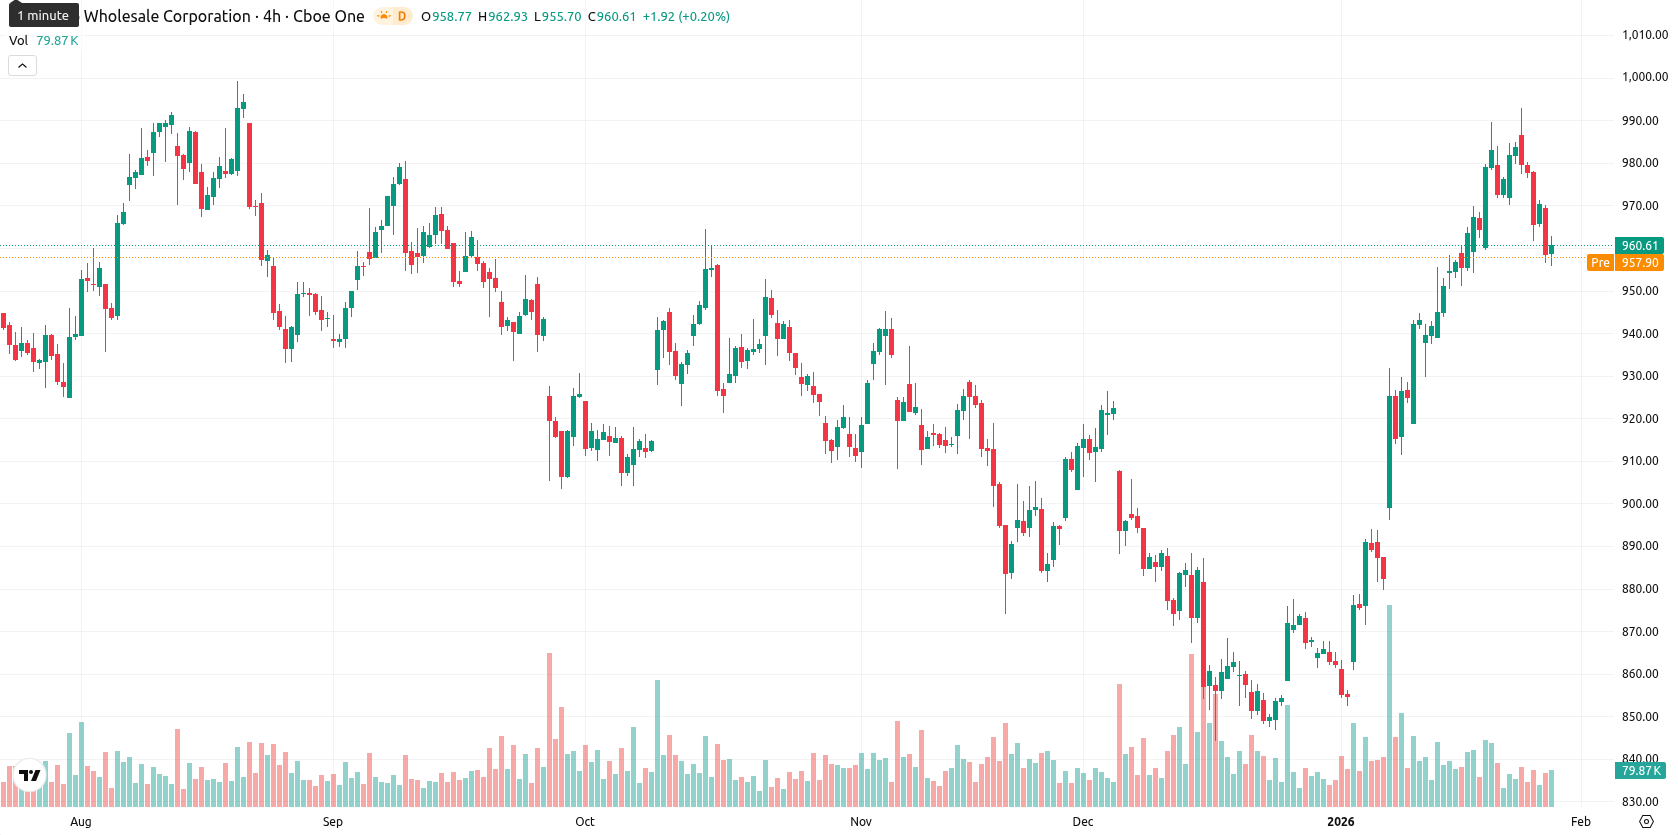
Costco Wholesale Corporation (COST) shares are currently trading at $960.84, having moved lower by $9.44, or approximately 0.97%, over the past week. The stock holds firmly above its weekly MA-20 ($932.19), MA-50 ($904.80), and MA-200 ($951.64), which maintains a strong bullish bias and confirms persistent upward pressure across all major weekly moving averages.
Highlights
- Costco shares are trading at $960.84, firmly above MA-20 ($932.19), MA-50 ($904.80), and MA-200 ($951.64), confirming bullish trends across timeframes.
- Key support levels are identified at the Ichimoku Kijun ($919.90), while resistance lies near MA-50 and the $970–$975 range, with volatility remaining moderate.
- Momentum is mixed—MACD, ADX, and most oscillators favor buyers, but some intraday selling and overbought signals suggest likely near-term consolidation within a $959 to $966 range.
Robust cash flows and capital allocation shape sentiment this week
Costco has demonstrated continued operational strength, with its fiscal 2025 operating cash flow surpassing net income by more than $5 billion and robust free cash flow supporting reinvestment in new warehouses and infrastructure. The company remains committed to disciplined capital allocation, prioritizing growth CAPEX, rising regular and special dividends, and targeted share repurchases, all underpinned by a strong balance sheet consisting mainly of long-dated senior notes and effective working capital management. Recent institutional activity has seen shifts such as Federated Hermes Inc. decreasing its position while Mirae Asset Global Investments and Truist Financial Corp increased their holdings.
Bullish technicals extend as momentum signals diverge during week
On the weekly chart, COST continues to show a bullish structure, trading well above all major W1 moving averages (MA-20, MA-50, MA-200) with the Ichimoku Kijun providing dynamic support around $919.90. Key resistance remains at the round $970–$975 zone, with immediate support near $959. Weekly RSI readings signal further upside potential with no immediate signs of overbought risk, and other oscillators suggest buyers still dominate, even as some divergence emerges in momentum indicators.
Rangebound consolidation expected as bullish bias dominates outlook
For the next five to seven trading days, the most probable scenario is a period of sideways consolidation in a narrow range between $959 and $966. The likelihood of a price increase is exceptionally high, and any pullback would likely be brief and limited before renewed buying emerges. A sustained break above $970 could set the stage for additional gains, while a decisive move below $959 would indicate short-lived profit-taking within a generally bullish trend.
Previously it was reported that Costco remains in a strong uptrend, trading well above all major moving averages with ongoing bullish momentum and dynamic support from the MA-50 and Ichimoku Kijun. However, momentum indicators such as RSI and several oscillators highlight overbought conditions, suggesting the potential for short-term consolidation or a modest pullback within a defined range, while strong moving average support is likely to limit downside risk.


-
 Afghanistan
-
 Albania
-
 Algeria
-
 Angola
-
 Argentina
-
 Armenia
-
 Australia
-
 Austria
-
 Azerbaijan
-
 Bahamas
-
 Bahrain
-
 Bangladesh
-
 Belarus
-
 Belgium
-
 Bolivia
-
 Botswana
-
 Brazil
-
 Brunei
-
 Bulgaria
-
 Cambodia
-
 Cameroon
-
 Canada
-
 Chile
Chile
-
 China
China
-
 Colombia
-
 Congo
Congo
-
 Costa Rica
-
 Cote d'Ivoire
-
 Croatia
-
 Cuba
Cuba
-
 Cyprus
-
 Czechia
-
 DR Congo
-
 Denmark
-
 Dominican Republic
-
 Ecuador
-
 Egypt
Egypt
-
 El Salvador
-
 Estonia
-
 Eswatini
-
 Ethiopia
-
 Finland
-
 France
-
 Georgia
-
 Germany
-
 Ghana
Ghana
-
 Greece
-
 Haiti
Haiti
-
 Hong Kong
-
 Hungary
-
 India
India
-
 Indonesia
-
 Iran, Islamic republic
-
 Iraq
Iraq
-
 Ireland
-
 Israel
-
 Italy
Italy
-
 Jamaica
-
 Japan
Japan
-
 Jordan
-
 Kazakhstan
-
 Kenya
Kenya
-
 Korea
Korea
-
 Kuwait
-
 Kyrgyzstan
-
 Laos
Laos
-
 Latvia
-
 Lebanon
-
 Lesotho
-
 Libya
Libya
-
 Lithuania
-
 Luxembourg
-
 Madagascar
-
 Malaysia
-
 Malta
Malta
-
 Mauritius
-
 Mexico
-
 Moldova
-
 Mongolia
-
 Montenegro
-
 Morocco
-
 Mozambique
-
 Myanmar
-
 Namibia
-
 Nepal
Nepal
-
 Netherlands
-
 New Zealand
-
 Nigeria
-
 North Macedonia
-
 Norway
-
 Oman
Oman
-
 Pakistan
-
 Palestine
-
 Panama
-
 Papua New Guinea
-
 Paraguay
-
 Peru
Peru
-
 Philippines
-
 Poland
-
 Portugal
-
 Puerto Rico
-
 Qatar
Qatar
-
 Reunion
-
 Romania
-
 Rwanda
-
 Saudi Arabia
-
 Serbia
-
 Singapore
-
 Slovakia
-
 Slovenia
-
 Somalia
-
 South Africa
-
 Spain
Spain
-
 Sri Lanka
-
 Sweden
-
 Switzerland
-
 Syria
Syria
-
 Taiwan
-
 Tajikistan
-
 Tanzania
-
 Thailand
-
 Trinidad and Tobago
-
 Tunisia
-
 Turkey
-
 UAE
UAE
-
 Uganda
-
 Ukraine
-
 United Kingdom
-
United States
-
 Uruguay
-
 Uzbekistan
-
 Venezuela
-
 Vietnam
-
 Yemen
Yemen
-
 Zambia
-
 Zimbabwe
- Forex
- Crypto
