
CleanSpark stock price forecast: Sideways action likely as CLSK trades near support after 3.42% drop

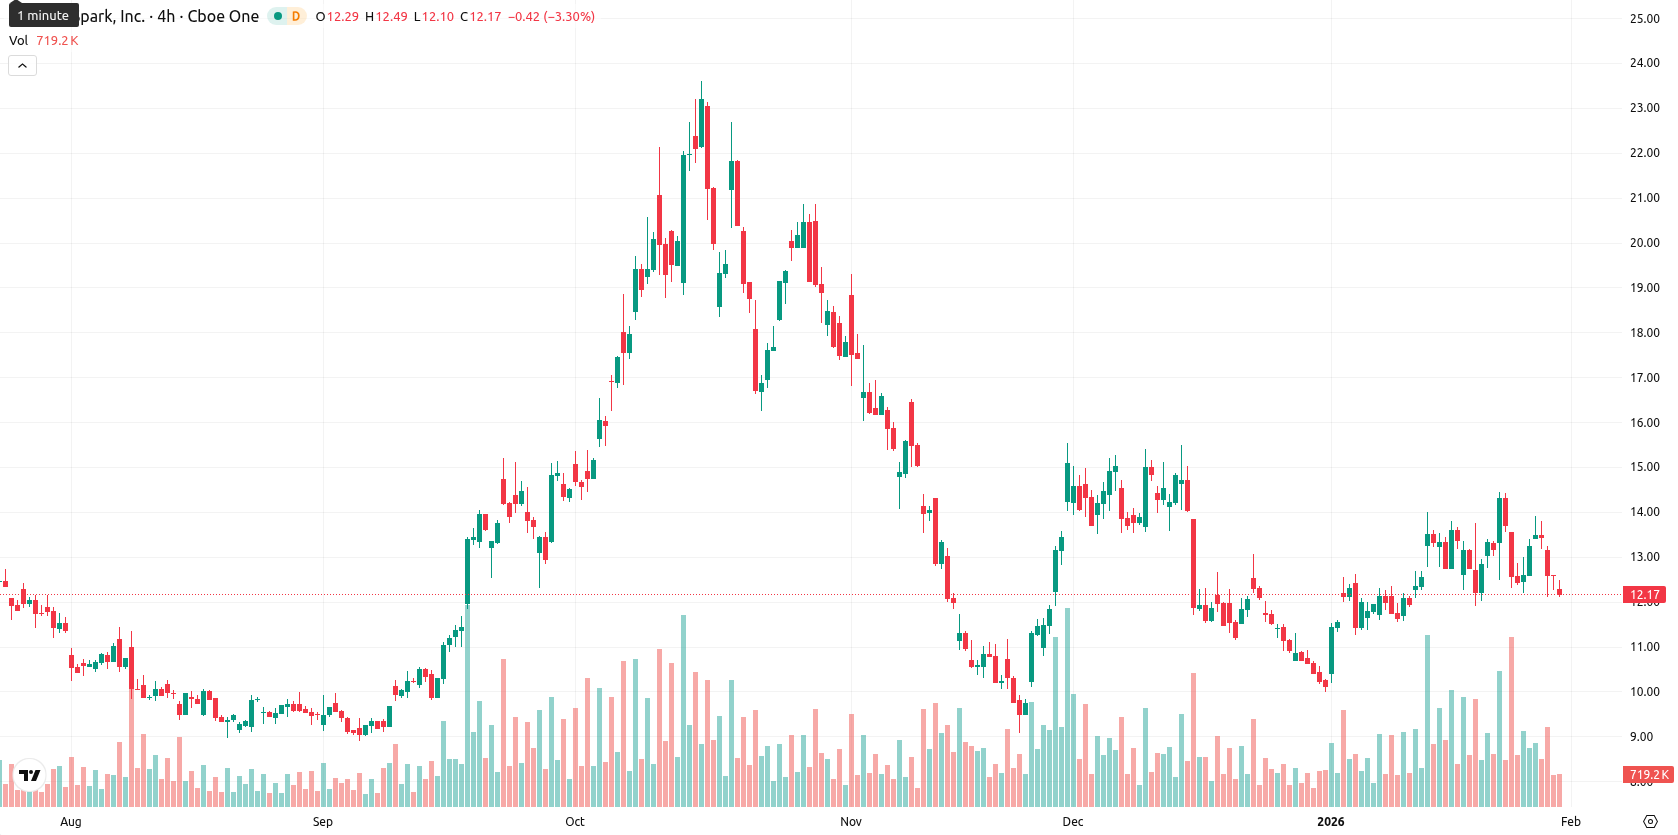
CleanSpark, Inc. (CLSK) is trading at $12.16 after slipping 3.42% intraday, remaining below the MA-20 ($12.48) and MA-50 ($12.43), but still above the MA-200 ($12.03). This places short- and medium-term pressure on the stock while a long-term support is maintained, with the price near dynamic support at the Ichimoku Kijun ($12.21) and resistance at the MA-50.
Highlights
- CleanSpark will release its first quarter 2026 earnings report before the market opens on Thursday, February 5.
- CLSK is trading at $12.16, below both the MA-20 ($12.48) and MA-50 ($12.43) but above the MA-200 ($12.03), reflecting short- to medium-term selling pressure.
- Near-term support sits at the Ichimoku Kijun level ($12.21) with resistance at the MA-50 ($12.43); probability of a price increase is low, with further declines likely.
Earnings release anticipated as investors weigh upcoming results
CleanSpark is set to release its first quarter 2026 earnings report before the market opens on Thursday, February 5.
Conflicted momentum as resistance holds amid oversold conditions
Technical analysis points to a mixed setup. CLSK remains beneath both the MA-20 and MA-50, reflecting short- and medium-term resistance, yet it holds above the MA-200 at $12.03, with dynamic support at the Ichimoku Kijun ($12.21) and resistance at the MA-50 ($12.43). Momentum signals are conflicted: the daily MACD shows mild bullish tone, but the ADX signals weak trend strength, while the RSI, Stochastic RSI, and Commodity Channel Index hover near neutral or oversold levels. Bull/Bear Power readings suggest the market is oversold due to seller dominance, and intraday action shows subdued volatility with price near the session low.
Downside risk prevails as technical signals favor further declines
Over the next five days, CLSK is likely to trade within a typical volatility band from $11.10 to $13.40 around current levels. The probability of a price increase is low, as only 1 out of 4 key weekly signals indicate a buy, so further declines are more likely. In the baseline scenario, price action should remain sideways within this corridor. A push above $12.43 could test $13.40, while a drop below the Ichimoku Kijun at $12.21 would put the $11.10 zone into play, confirming further short-term weakness.
Previously it was reported that CleanSpark, Inc. is trading just above its 20-day and 50-day moving averages and well above the 200-day, indicating ongoing upward momentum and firm long-term support. Technical signals are mixed with a mildly bullish RSI, positive MACD, and buyer dominance, but caution is warranted due to weak trend strength, some overbought signals, and heightened volatility within a consolidation range.


Latest CleanSpark News


-
 Afghanistan
-
 Albania
-
 Algeria
-
 Angola
-
 Argentina
-
 Armenia
-
 Australia
-
 Austria
-
 Azerbaijan
-
 Bahamas
-
 Bahrain
-
 Bangladesh
-
 Belarus
-
 Belgium
-
 Bolivia
-
 Botswana
-
 Brazil
-
 Brunei
-
 Bulgaria
-
 Cambodia
-
 Cameroon
-
 Canada
-
 Chile
Chile
-
 China
China
-
 Colombia
-
 Congo
Congo
-
 Costa Rica
-
 Cote d'Ivoire
-
 Croatia
-
 Cuba
Cuba
-
 Cyprus
-
 Czechia
-
 DR Congo
-
 Denmark
-
 Dominican Republic
-
 Ecuador
-
 Egypt
Egypt
-
 El Salvador
-
 Estonia
-
 Eswatini
-
 Ethiopia
-
 Finland
-
 France
-
 Georgia
-
 Germany
-
 Ghana
Ghana
-
 Greece
-
 Haiti
Haiti
-
 Hong Kong
-
 Hungary
-
 India
India
-
 Indonesia
-
 Iran, Islamic republic
-
 Iraq
Iraq
-
 Ireland
-
 Israel
-
 Italy
Italy
-
 Jamaica
-
 Japan
Japan
-
 Jordan
-
 Kazakhstan
-
 Kenya
Kenya
-
 Korea
Korea
-
 Kuwait
-
 Kyrgyzstan
-
 Laos
Laos
-
 Latvia
-
 Lebanon
-
 Lesotho
-
 Libya
Libya
-
 Lithuania
-
 Luxembourg
-
 Madagascar
-
 Malaysia
-
 Malta
Malta
-
 Mauritius
-
 Mexico
-
 Moldova
-
 Mongolia
-
 Montenegro
-
 Morocco
-
 Mozambique
-
 Myanmar
-
 Namibia
-
 Nepal
Nepal
-
 Netherlands
-
 New Zealand
-
 Nigeria
-
 North Macedonia
-
 Norway
-
 Oman
Oman
-
 Pakistan
-
 Palestine
-
 Panama
-
 Papua New Guinea
-
 Paraguay
-
 Peru
Peru
-
 Philippines
-
 Poland
-
 Portugal
-
 Puerto Rico
-
 Qatar
Qatar
-
 Reunion
-
 Romania
-
 Rwanda
-
 Saudi Arabia
-
 Serbia
-
 Singapore
-
 Slovakia
-
 Slovenia
-
 Somalia
-
 South Africa
-
 Spain
Spain
-
 Sri Lanka
-
 Sweden
-
 Switzerland
-
 Syria
Syria
-
 Taiwan
-
 Tajikistan
-
 Tanzania
-
 Thailand
-
 Trinidad and Tobago
-
 Tunisia
-
 Turkey
-
 UAE
UAE
-
 Uganda
-
 Ukraine
-
 United Kingdom
-
United States
-
 Uruguay
-
 Uzbekistan
-
 Venezuela
-
 Vietnam
-
 Yemen
Yemen
-
 Zambia
-
 Zimbabwe
- Forex
- Crypto
