
AMZN weekly forecast: mild selloff contained — momentum and cloud division sustain medium-term uptrend

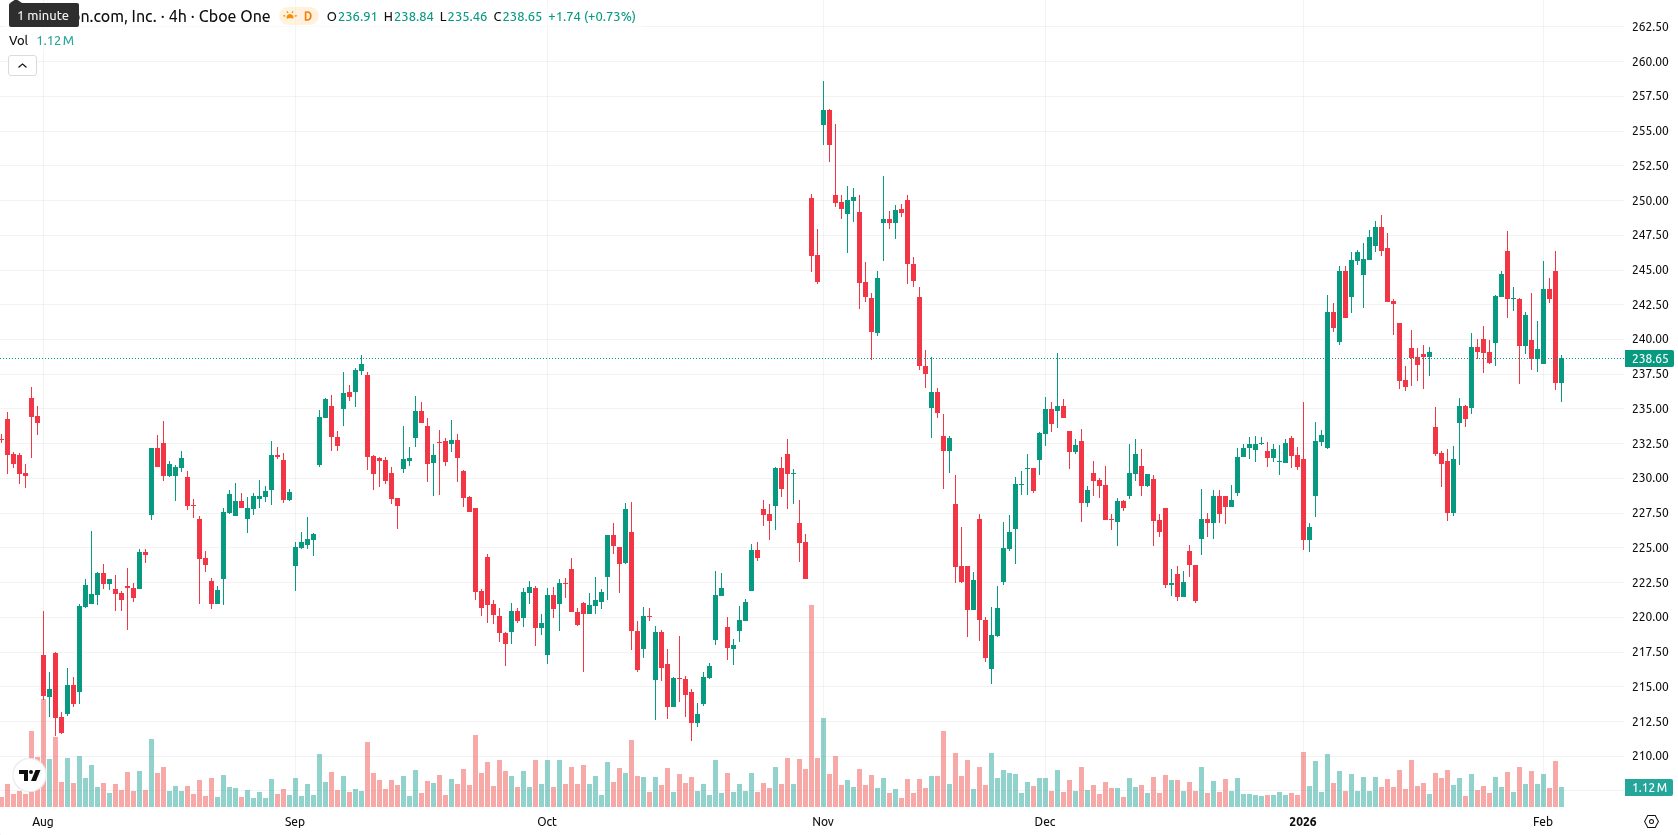
Amazon.com, Inc. (AMZN) closed the week at $238.74, representing a decline of $4.22 or 1.74%. The asset remains just below its 20-week Moving Average ($240.20), while holding above its key 50-week ($233.26) and 200-week ($222.42) moving averages, indicating mild short-term selling pressure but positive medium- and long-term trends.
Highlights
- Amazon (AMZN) trades at $238.74, below the 20-day MA ($240.20) but above the 50-day ($233.26) and 200-day ($222.42), signaling medium- and long-term uptrends.
- Key short-term support is at the Ichimoku Kijun ($236.84) and resistance is at the 50-day MA and recent highs, with increased selling pressure after a 1.74% price drop.
- Despite short-term consolidation near session lows and overbought momentum readings, probability of an upward move is high (75%) with a $235–$247 range over the next five days.
AWS growth and AI investments shape sentiment ahead of earnings
Amazon is set to report its fourth-quarter 2025 earnings on February 5, with sales expectations between $206 billion and $213 billion. Growth in its AWS cloud division continues to support overall performance, delivering $33 billion in revenue in the previous quarter, up 20.2% year-over-year. Investors are also watching advertising, capital expenditure guidance, and the impact of recent AI-related investments.
Ongoing bullish momentum as weekly technicals reinforce support
On the weekly chart, AMZN's price action shows a retracement but continues to trade above the 50-week and 200-week moving averages, underlining the underlying bullish trend. Weekly dynamic support sits at the Ichimoku Kijun near $236.84, with resistance aligning to the 20-week MA and recent highs near $247. Weekly RSI signals a mildly bullish environment, while the alignment of major moving averages reinforces medium-term support and resilience against deeper pullbacks.
Sideways bias expected as range-bound momentum persists next week
Looking ahead, AMZN is likely to consolidate between support at $235 and resistance at $247 over the next week. Weekly momentum indicators, including RSI, MACD, and the 50-week average, point to a strong probability (75%) of an upward move should resistance be overtaken; however, a drop below $235 could trigger a bearish scenario. The most probable course is sideways movement within the band, with buyers maintaining medium-term control unless immediate support is lost.
Previously it was reported that Amazon is trading just below its short-term moving average but remains above key medium- and long-term supports, with technical indicators reflecting mixed momentum and a moderate bullish bias. Near-term seller pressure is evident, but the broader uptrend is intact, with critical support seen around $236 and resistance near $240, positioning the shares to potentially consolidate and attempt an advance if bullish signals strengthen.


Latest Amazon News


-
 Afghanistan
-
 Albania
-
 Algeria
-
 Angola
-
 Argentina
-
 Armenia
-
 Australia
-
 Austria
-
 Azerbaijan
-
 Bahamas
-
 Bahrain
-
 Bangladesh
-
 Belarus
-
 Belgium
-
 Bolivia
-
 Botswana
-
 Brazil
-
 Brunei
-
 Bulgaria
-
 Cambodia
-
 Cameroon
-
 Canada
-
 Chile
Chile
-
 China
China
-
 Colombia
-
 Congo
Congo
-
 Costa Rica
-
 Cote d'Ivoire
-
 Croatia
-
 Cuba
Cuba
-
 Cyprus
-
 Czechia
-
 DR Congo
-
 Denmark
-
 Dominican Republic
-
 Ecuador
-
 Egypt
Egypt
-
 El Salvador
-
 Estonia
-
 Eswatini
-
 Ethiopia
-
 Finland
-
 France
-
 Georgia
-
 Germany
-
 Ghana
Ghana
-
 Greece
-
 Haiti
Haiti
-
 Hong Kong
-
 Hungary
-
 India
India
-
 Indonesia
-
 Iran, Islamic republic
-
 Iraq
Iraq
-
 Ireland
-
 Israel
-
 Italy
Italy
-
 Jamaica
-
 Japan
Japan
-
 Jordan
-
 Kazakhstan
-
 Kenya
Kenya
-
 Korea
Korea
-
 Kuwait
-
 Kyrgyzstan
-
 Laos
Laos
-
 Latvia
-
 Lebanon
-
 Lesotho
-
 Libya
Libya
-
 Lithuania
-
 Luxembourg
-
 Madagascar
-
 Malaysia
-
 Malta
Malta
-
 Mauritius
-
 Mexico
-
 Moldova
-
 Mongolia
-
 Montenegro
-
 Morocco
-
 Mozambique
-
 Myanmar
-
 Namibia
-
 Nepal
Nepal
-
 Netherlands
-
 New Zealand
-
 Nigeria
-
 North Macedonia
-
 Norway
-
 Oman
Oman
-
 Pakistan
-
 Palestine
-
 Panama
-
 Papua New Guinea
-
 Paraguay
-
 Peru
Peru
-
 Philippines
-
 Poland
-
 Portugal
-
 Puerto Rico
-
 Qatar
Qatar
-
 Reunion
-
 Romania
-
 Rwanda
-
 Saudi Arabia
-
 Serbia
-
 Singapore
-
 Slovakia
-
 Slovenia
-
 Somalia
-
 South Africa
-
 Spain
Spain
-
 Sri Lanka
-
 Sweden
-
 Switzerland
-
 Syria
Syria
-
 Taiwan
-
 Tajikistan
-
 Tanzania
-
 Thailand
-
 Trinidad and Tobago
-
 Tunisia
-
 Turkey
-
 UAE
UAE
-
 Uganda
-
 Ukraine
-
 United Kingdom
-
United States
-
 Uruguay
-
 Uzbekistan
-
 Venezuela
-
 Vietnam
-
 Yemen
Yemen
-
 Zambia
-
 Zimbabwe
- Forex
- Crypto
