
AMD stock price forecast: Bullish long-term structure as AMD drops below key moving averages

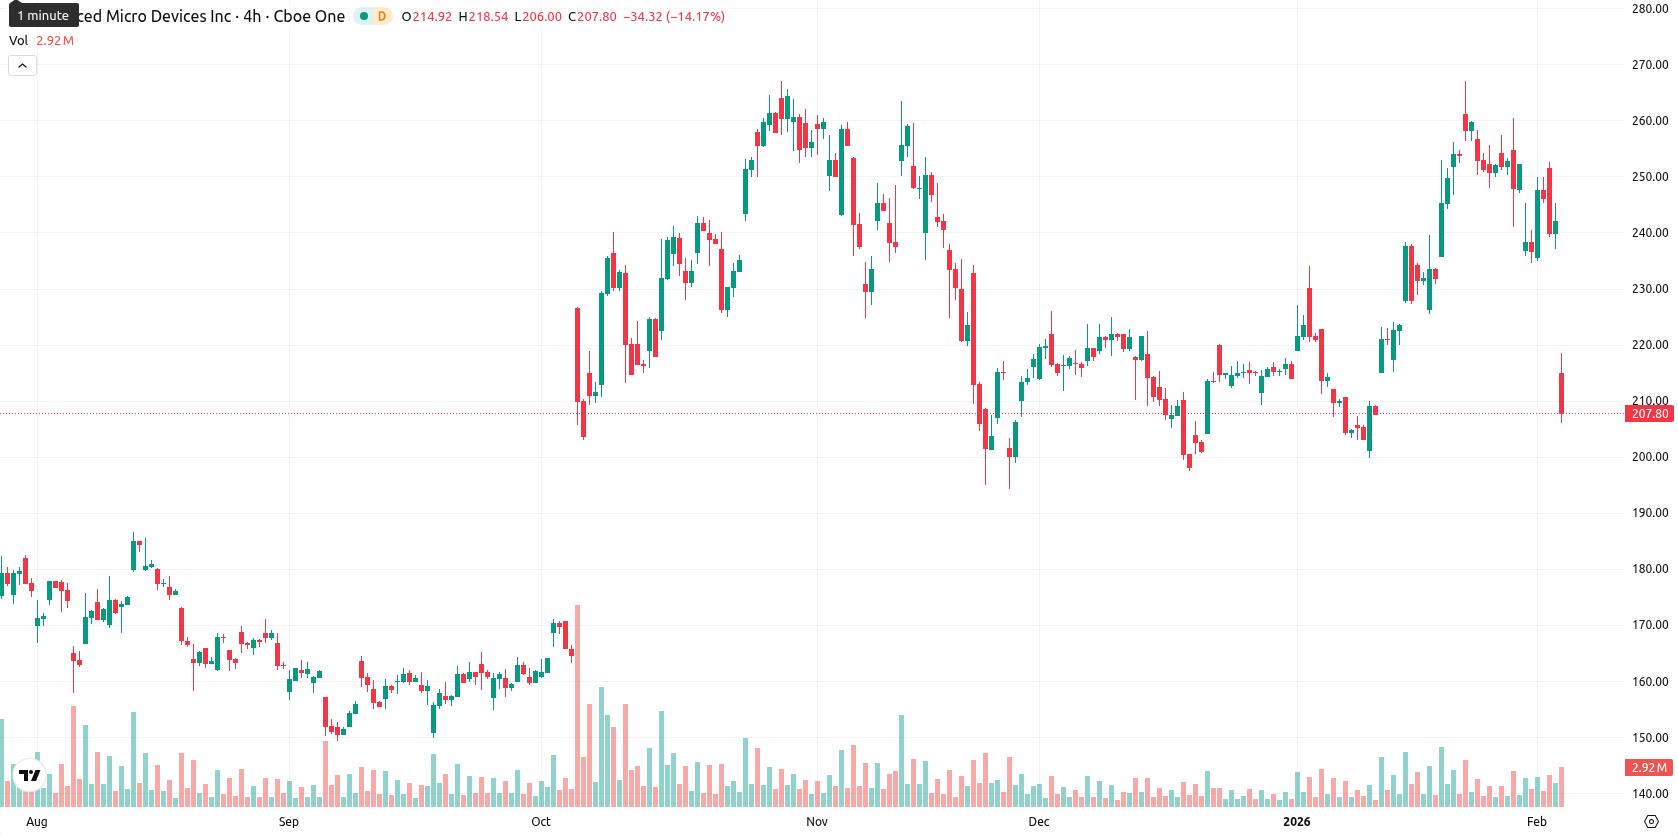
Advanced Micro Devices, Inc. (AMD) is trading at $207.39, well below the MA-20 at $233.64 and the MA-50 at $221.94, but still above the MA-200 at $177.32. This indicates strong short- and medium-term bearish pressure, while the longer-term structure remains bullish.
Highlights
- AMD reported record Q4 2025 results with revenue up 34% year-over-year to $10.3 billion and net income rising 42% to $2.5 billion.
- Annual revenue for 2025 hit a record $34.6 billion, driven by growth in data center, client, and AI businesses plus one-time China GPU and inventory reserve boosts.
- AMD trades at $207.39, below MA-20 and MA-50 but above MA-200 ($177.32); weekly technicals indicate >80% probability of a price rebound toward $220.00.
Revenue, earnings and GPU sales surge drive record quarterly results
AMD reported record fourth-quarter 2025 financial results, with revenue rising 34% year-over-year to $10.3 billion and net income increasing 42% to $2.5 billion. The company's 2025 annual revenue reached a record $34.6 billion, fueled by robust growth in data center, client, and AI business segments on the back of new product launches and higher customer adoption of EPYC CPUs and Instinct GPUs. Quarterly results were strengthened by $390 million in nonrecurring China GPU sales and a $306 million boost from a released inventory reserve, while strategic partnerships, all-time highs in cash flow and share buybacks also contributed to the positive news flow.
Mixed momentum signals and weak trend strength sustain volatility
Momentum indicators are mixed: the MACD is on a strong daily buy signal, but the ADX shows weak trend strength. The RSI is neutral to positive, while the Stochastic RSI and CCI both indicate oversold conditions, suggesting near-term selling exhaustion. Bull/Bear Power points to sellers dominating the session, as the price is sharply down with a gap at the open and trading near the day's low within a volatile range. The Awesome Oscillator is neutral, and broad indicator divergence signals short-term uncertainty amid high volatility and strong downward pressure.
Recovery prospects rise as buy signals align with volatility corridor
For the coming week, AMD is likely to trade between $200.00 and $220.00, representing the typical volatility band relative to current levels. The probability of a price increase is very high (over 80%), given consistent weekly buy signals from the RSI, ADX, MACD, and MA-50. The chance of further decline is minimal, so a recovery within this corridor is the baseline scenario. A break above $220.00 could target $233.00, while bearish action below $200.00 would open the way to medium-term support near $190.00.
Previously it was reported that AMD is trading well below its short- and medium-term moving averages but remains structurally bullish above its long-term average, with resistance defined near the Kijun level. Momentum and oscillator signals are mixed, with intraday bearishness and high volatility dominating short-term price action despite constructive medium-term indicators.


Latest AMD News


-
 Afghanistan
-
 Albania
-
 Algeria
-
 Angola
-
 Argentina
-
 Armenia
-
 Australia
-
 Austria
-
 Azerbaijan
-
 Bahamas
-
 Bahrain
-
 Bangladesh
-
 Belarus
-
 Belgium
-
 Bolivia
-
 Botswana
-
 Brazil
-
 Brunei
-
 Bulgaria
-
 Cambodia
-
 Cameroon
-
 Canada
-
 Chile
Chile
-
 China
China
-
 Colombia
-
 Congo
Congo
-
 Costa Rica
-
 Cote d'Ivoire
-
 Croatia
-
 Cuba
Cuba
-
 Cyprus
-
 Czechia
-
 DR Congo
-
 Denmark
-
 Dominican Republic
-
 Ecuador
-
 Egypt
Egypt
-
 El Salvador
-
 Estonia
-
 Eswatini
-
 Ethiopia
-
 Finland
-
 France
-
 Georgia
-
 Germany
-
 Ghana
Ghana
-
 Greece
-
 Haiti
Haiti
-
 Hong Kong
-
 Hungary
-
 India
India
-
 Indonesia
-
 Iran, Islamic republic
-
 Iraq
Iraq
-
 Ireland
-
 Israel
-
 Italy
Italy
-
 Jamaica
-
 Japan
Japan
-
 Jordan
-
 Kazakhstan
-
 Kenya
Kenya
-
 Korea
Korea
-
 Kuwait
-
 Kyrgyzstan
-
 Laos
Laos
-
 Latvia
-
 Lebanon
-
 Lesotho
-
 Libya
Libya
-
 Lithuania
-
 Luxembourg
-
 Madagascar
-
 Malaysia
-
 Malta
Malta
-
 Mauritius
-
 Mexico
-
 Moldova
-
 Mongolia
-
 Montenegro
-
 Morocco
-
 Mozambique
-
 Myanmar
-
 Namibia
-
 Nepal
Nepal
-
 Netherlands
-
 New Zealand
-
 Nigeria
-
 North Macedonia
-
 Norway
-
 Oman
Oman
-
 Pakistan
-
 Palestine
-
 Panama
-
 Papua New Guinea
-
 Paraguay
-
 Peru
Peru
-
 Philippines
-
 Poland
-
 Portugal
-
 Puerto Rico
-
 Qatar
Qatar
-
 Reunion
-
 Romania
-
 Rwanda
-
 Saudi Arabia
-
 Serbia
-
 Singapore
-
 Slovakia
-
 Slovenia
-
 Somalia
-
 South Africa
-
 Spain
Spain
-
 Sri Lanka
-
 Sweden
-
 Switzerland
-
 Syria
Syria
-
 Taiwan
-
 Tajikistan
-
 Tanzania
-
 Thailand
-
 Trinidad and Tobago
-
 Tunisia
-
 Turkey
-
 UAE
UAE
-
 Uganda
-
 Ukraine
-
 United Kingdom
-
United States
-
 Uruguay
-
 Uzbekistan
-
 Venezuela
-
 Vietnam
-
 Yemen
Yemen
-
 Zambia
-
 Zimbabwe
- Forex
- Crypto
