
Oversold technicals and capital raise weigh on outlook — SoFi stock drops 6.32%

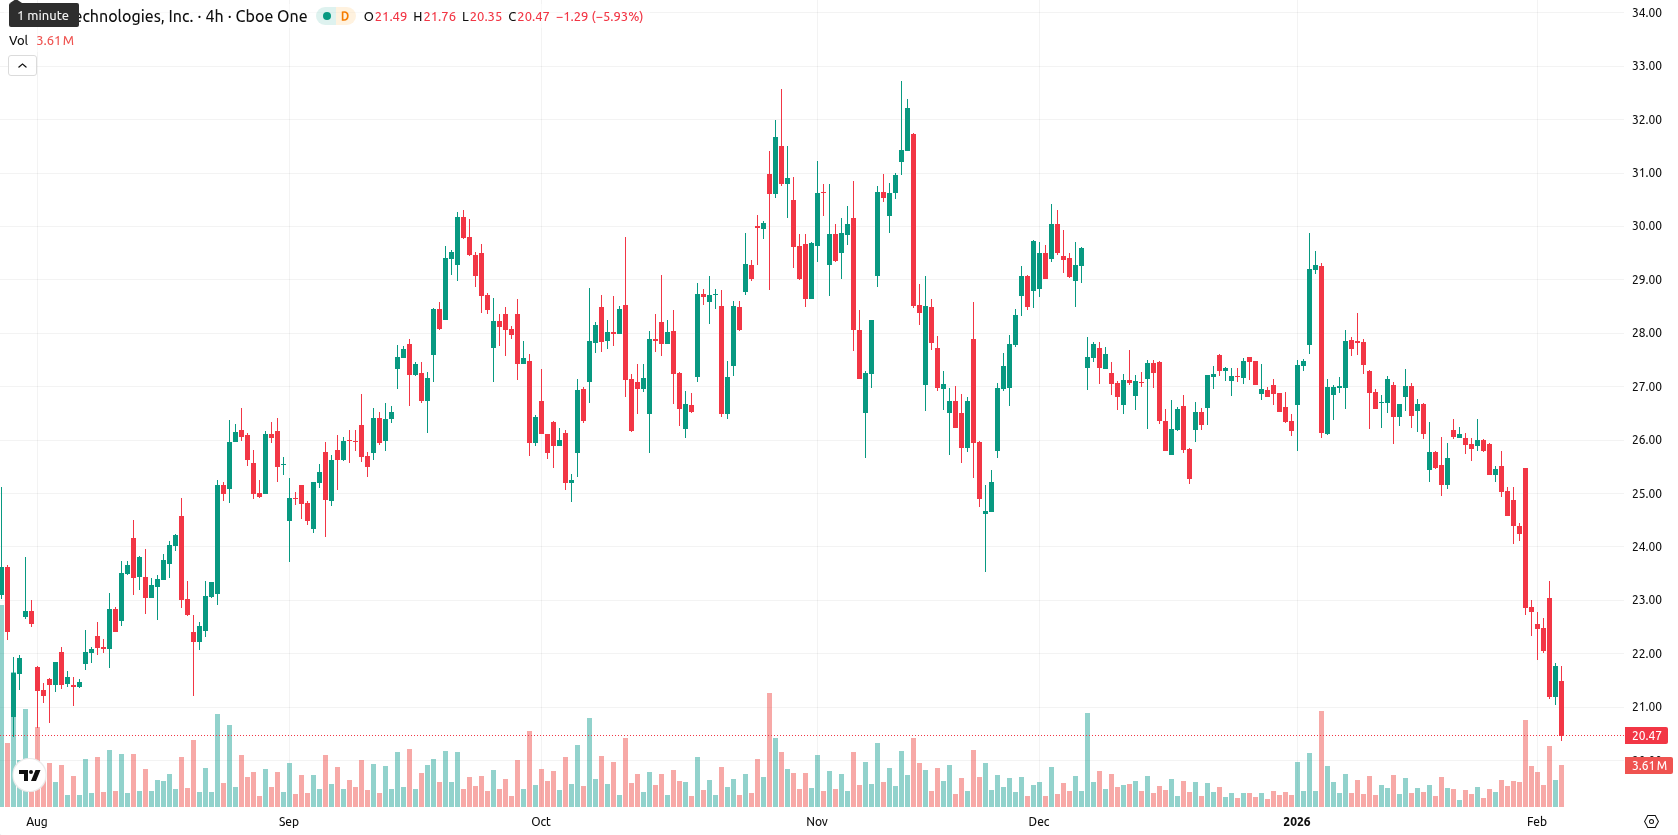
SoFi Technologies, Inc (SOFI) is trading at $20.39 after a sharp decline of 6.32% today, marking a significant move below the MA-20 ($25.60), MA-50 ($26.67), and MA-200 ($22.80). This positions the asset well beneath all key moving averages and highlights sustained downward pressure in the short, medium, and long term.
Highlights
- SoFi reported fourth-quarter 2025 earnings per share of $0.13 and revenue of $1.03 billion, both surpassing analyst expectations.
- The company is liquidating the SoFi Next 500 ETF (SFYX) and raised $1.5 billion via share offering to strengthen capital ratios and acquisition capability.
- SOFI trades at $20.39, well below key moving averages with a bearish technical outlook and support seen between $19.50–$22.50, probability of price increase below 20%.
Capital boost and ETF exit as SOFI pivots after earnings beat
SoFi reported strong fourth-quarter 2025 results, with earnings per share of $0.13 and $1.03 billion in revenue, both above expectations. The company announced the liquidation and termination of the SoFi Next 500 ETF (SFYX) as it refocuses on its core banking, lending, and technology platform. Additionally, SoFi raised $1.5 billion through a share offering to boost capital ratios, with speculation this move enhances its readiness for potential fintech acquisitions.
Oversold signals deepen as bearish pressure breaches vital supports
The nearest resistance is set by the Ichimoku Kijun at $25.45, while the current price has broken below all major dynamic supports. Momentum remains bearish on the daily timeframe: the MACD is firmly in sell territory, the ADX shows low trend strength, and both the RSI (25.99) and Commodity Channel Index (-207.46) signal oversold conditions. The Stochastic RSI is deeply oversold, Bull/Bear Power is strongly negative, and the Awesome Oscillator is confirming the persistent seller dominance. High intraday volatility and continued pressure following the open confirm the prevailing bearish tone.
Limited rebound prospects as technical weakness and volatility persist
For the week ahead, SOFI is expected to trade within a typical volatility band of $19.50 – $22.50, reflecting recent sharp movements and the current oversold condition. The probability of an upward price move is low (less than 20%), pointing to a higher likelihood of further declines. The base case anticipates sideways activity constrained by oversold signals, but a sustained break above $22.50 could reopen the path to $24.00, while a drop below $19.50 risks accelerating the current downtrend.
Last time, analysts noted that SoFi Technologies Inc was experiencing persistent selling pressure, with its stock trading well below key short- and long-term moving averages and exhibiting deeply oversold conditions across multiple technical indicators such as RSI, Stoch RSI, and MACD. Momentum remains negative amid heightened volatility, with the price testing long-term support while dynamic resistance and weak ADX readings indicate sellers remain firmly in control.


Latest SoFi News


-
 Afghanistan
-
 Albania
-
 Algeria
-
 Angola
-
 Argentina
-
 Armenia
-
 Australia
-
 Austria
-
 Azerbaijan
-
 Bahamas
-
 Bahrain
-
 Bangladesh
-
 Belarus
-
 Belgium
-
 Bolivia
-
 Botswana
-
 Brazil
-
 Brunei
-
 Bulgaria
-
 Cambodia
-
 Cameroon
-
 Canada
-
 Chile
Chile
-
 China
China
-
 Colombia
-
 Congo
Congo
-
 Costa Rica
-
 Cote d'Ivoire
-
 Croatia
-
 Cuba
Cuba
-
 Cyprus
-
 Czechia
-
 DR Congo
-
 Denmark
-
 Dominican Republic
-
 Ecuador
-
 Egypt
Egypt
-
 El Salvador
-
 Estonia
-
 Eswatini
-
 Ethiopia
-
 Finland
-
 France
-
 Georgia
-
 Germany
-
 Ghana
Ghana
-
 Greece
-
 Haiti
Haiti
-
 Hong Kong
-
 Hungary
-
 India
India
-
 Indonesia
-
 Iran, Islamic republic
-
 Iraq
Iraq
-
 Ireland
-
 Israel
-
 Italy
Italy
-
 Jamaica
-
 Japan
Japan
-
 Jordan
-
 Kazakhstan
-
 Kenya
Kenya
-
 Korea
Korea
-
 Kuwait
-
 Kyrgyzstan
-
 Laos
Laos
-
 Latvia
-
 Lebanon
-
 Lesotho
-
 Libya
Libya
-
 Lithuania
-
 Luxembourg
-
 Madagascar
-
 Malaysia
-
 Malta
Malta
-
 Mauritius
-
 Mexico
-
 Moldova
-
 Mongolia
-
 Montenegro
-
 Morocco
-
 Mozambique
-
 Myanmar
-
 Namibia
-
 Nepal
Nepal
-
 Netherlands
-
 New Zealand
-
 Nigeria
-
 North Macedonia
-
 Norway
-
 Oman
Oman
-
 Pakistan
-
 Palestine
-
 Panama
-
 Papua New Guinea
-
 Paraguay
-
 Peru
Peru
-
 Philippines
-
 Poland
-
 Portugal
-
 Puerto Rico
-
 Qatar
Qatar
-
 Reunion
-
 Romania
-
 Rwanda
-
 Saudi Arabia
-
 Serbia
-
 Singapore
-
 Slovakia
-
 Slovenia
-
 Somalia
-
 South Africa
-
 Spain
Spain
-
 Sri Lanka
-
 Sweden
-
 Switzerland
-
 Syria
Syria
-
 Taiwan
-
 Tajikistan
-
 Tanzania
-
 Thailand
-
 Trinidad and Tobago
-
 Tunisia
-
 Turkey
-
 UAE
UAE
-
 Uganda
-
 Ukraine
-
 United Kingdom
-
United States
-
 Uruguay
-
 Uzbekistan
-
 Venezuela
-
 Vietnam
-
 Yemen
Yemen
-
 Zambia
-
 Zimbabwe
- Forex
- Crypto
