
Riot Platforms stock declines as bearish technicals and volatility dominate trading

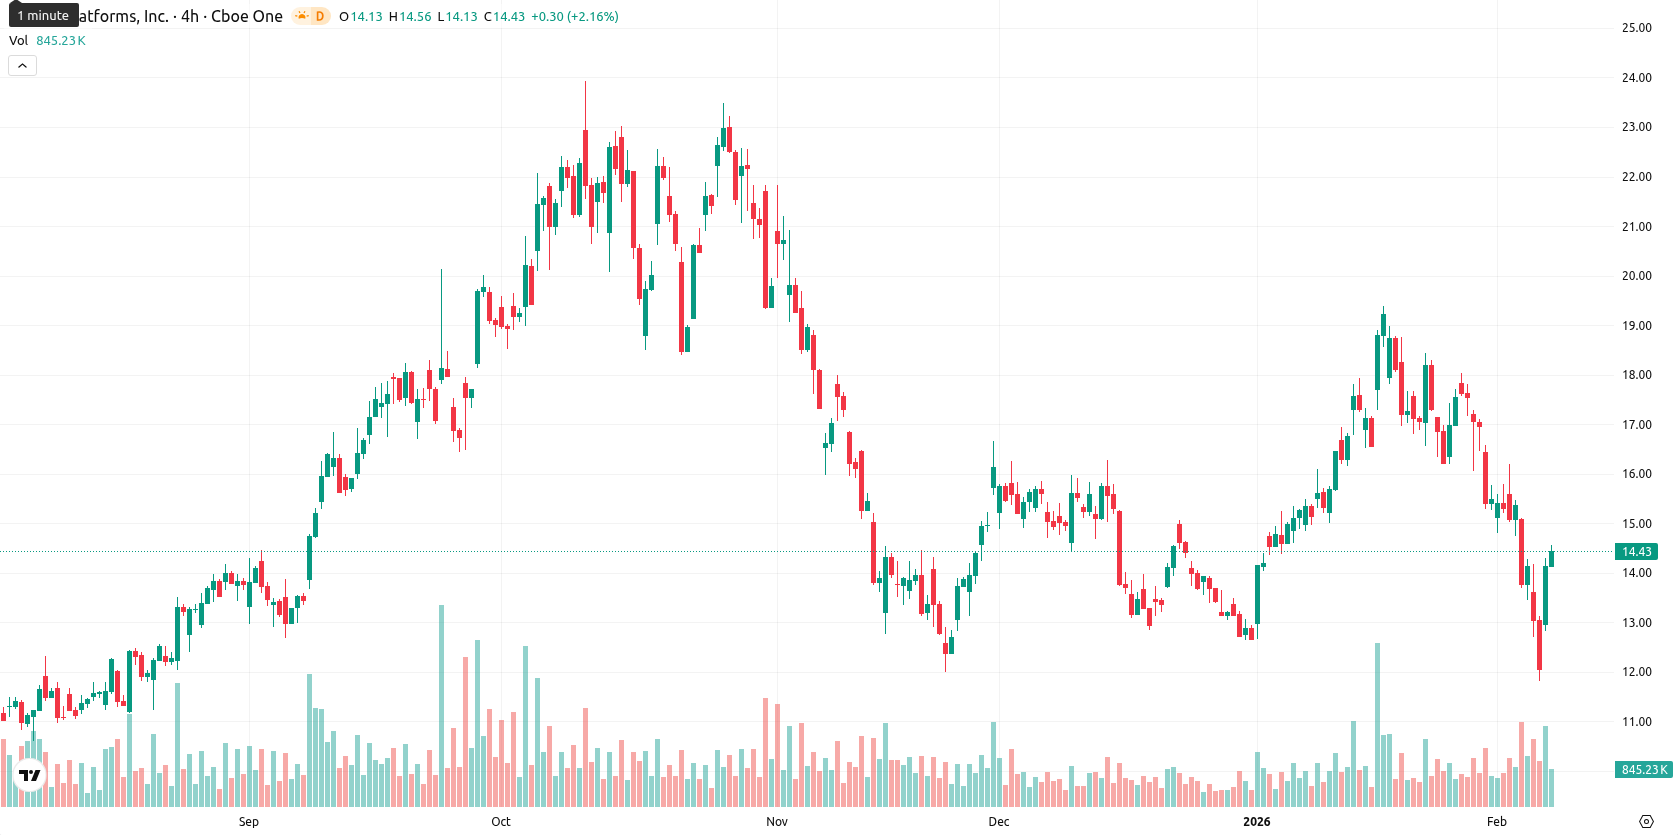
Riot Platforms, Inc. (RIOT, formerly Riot Blockchain) is trading at $13.92, remaining below the MA-20 ($16.32), MA-50 ($15.25), and just under the MA-200 ($14.02), indicating sustained short- and medium-term selling pressure while hovering near its longer-term support zone. The closest dynamic support is the Ichimoku Kijun at $15.58, which now acts as key resistance ahead.
Highlights
- RIOT trades at $13.92, staying below the MA-20 ($16.32), MA-50 ($15.25), and just below the MA-200 ($14.02), signaling persistent selling pressure.
- Momentum indicators are mixed with a neutral daily MACD, a soft RSI at 45.14, oversold signals, and an intraday bounce against bearish sentiment.
- Key technical zones are Ichimoku resistance at $15.58 and a support range of $12.80–$15.50, with an 80% probability of upside consolidation.
Divergent signals as oversold momentum meets intraday rebound
Momentum readings are mixed: the daily MACD is neutral and the ADX signals limited directionality, pointing to subdued trend strength. The RSI remains soft at 45.14, with the Commodity Channel Index and Bull/Bear Power both giving clear oversold and seller-dominance signals, while the Stochastic RSI points to a possible strong buy. There was a notable down gap at the open (from $14.45 to $12.87), with the price now closer to the top end of today’s range ($12.86 – $14.56) after recovering some losses, suggesting high volatility and persistent pressure from sellers early on but some intraday rebound. The current signals show a divergence between short-term oversold readings and prevailing negative momentum, with the intraday bounce contradicting overall bearish sentiment.
Bullish bias favored as volatility shapes consolidation outlook
Looking ahead, with volatility elevated, the expected five-day range is adjusted to $12.80 – $15.50 to reflect a typical volatility band relative to current levels. Based on a predominance of bullish signals in higher timeframes (Moving Averages and MACD weekly), the probability of a price increase is high (more than 80%), while declines are less likely. The baseline scenario suggests price consolidation between $12.80 and $15.50. A bullish move would involve a sustained break above Ichimoku resistance ($15.58) toward $15.50, while a bearish scenario unfolds if the price drops below $12.80, exposing further downside.
Last time, analysts noted that Riot Platforms is trading narrowly below its major moving averages, with persistent short- and medium-term seller pressure and a long-term trend near a potential turning point. Technical indicators show weak support near the MA-200, capped upside at $15.59, a deeply oversold RSI, and mixed momentum, suggesting further downside is likely within a defined trading range.


-
 Afghanistan
-
 Albania
-
 Algeria
-
 Angola
-
 Argentina
-
 Armenia
-
 Australia
-
 Austria
-
 Azerbaijan
-
 Bahamas
-
 Bahrain
-
 Bangladesh
-
 Belarus
-
 Belgium
-
 Bolivia
-
 Botswana
-
 Brazil
-
 Brunei
-
 Bulgaria
-
 Cambodia
-
 Cameroon
-
 Canada
-
 Chile
Chile
-
 China
China
-
 Colombia
-
 Congo
Congo
-
 Costa Rica
-
 Cote d'Ivoire
-
 Croatia
-
 Cuba
Cuba
-
 Cyprus
-
 Czechia
-
 DR Congo
-
 Denmark
-
 Dominican Republic
-
 Ecuador
-
 Egypt
Egypt
-
 El Salvador
-
 Estonia
-
 Eswatini
-
 Ethiopia
-
 Finland
-
 France
-
 Georgia
-
 Germany
-
 Ghana
Ghana
-
 Greece
-
 Haiti
Haiti
-
 Hong Kong
-
 Hungary
-
 India
India
-
 Indonesia
-
 Iran, Islamic republic
-
 Iraq
Iraq
-
 Ireland
-
 Israel
-
 Italy
Italy
-
 Jamaica
-
 Japan
Japan
-
 Jordan
-
 Kazakhstan
-
 Kenya
Kenya
-
 Korea
Korea
-
 Kuwait
-
 Kyrgyzstan
-
 Laos
Laos
-
 Latvia
-
 Lebanon
-
 Lesotho
-
 Libya
Libya
-
 Lithuania
-
 Luxembourg
-
 Madagascar
-
 Malaysia
-
 Malta
Malta
-
 Mauritius
-
 Mexico
-
 Moldova
-
 Mongolia
-
 Montenegro
-
 Morocco
-
 Mozambique
-
 Myanmar
-
 Namibia
-
 Nepal
Nepal
-
 Netherlands
-
 New Zealand
-
 Nigeria
-
 North Macedonia
-
 Norway
-
 Oman
Oman
-
 Pakistan
-
 Palestine
-
 Panama
-
 Papua New Guinea
-
 Paraguay
-
 Peru
Peru
-
 Philippines
-
 Poland
-
 Portugal
-
 Puerto Rico
-
 Qatar
Qatar
-
 Reunion
-
 Romania
-
 Rwanda
-
 Saudi Arabia
-
 Serbia
-
 Singapore
-
 Slovakia
-
 Slovenia
-
 Somalia
-
 South Africa
-
 Spain
Spain
-
 Sri Lanka
-
 Sweden
-
 Switzerland
-
 Syria
Syria
-
 Taiwan
-
 Tajikistan
-
 Tanzania
-
 Thailand
-
 Trinidad and Tobago
-
 Tunisia
-
 Turkey
-
 UAE
UAE
-
 Uganda
-
 Ukraine
-
 United Kingdom
-
United States
-
 Uruguay
-
 Uzbekistan
-
 Venezuela
-
 Vietnam
-
 Yemen
Yemen
-
 Zambia
-
 Zimbabwe
- Forex
- Crypto
