
Robinhood stock: Record annual EPS fails to stop steep daily decline

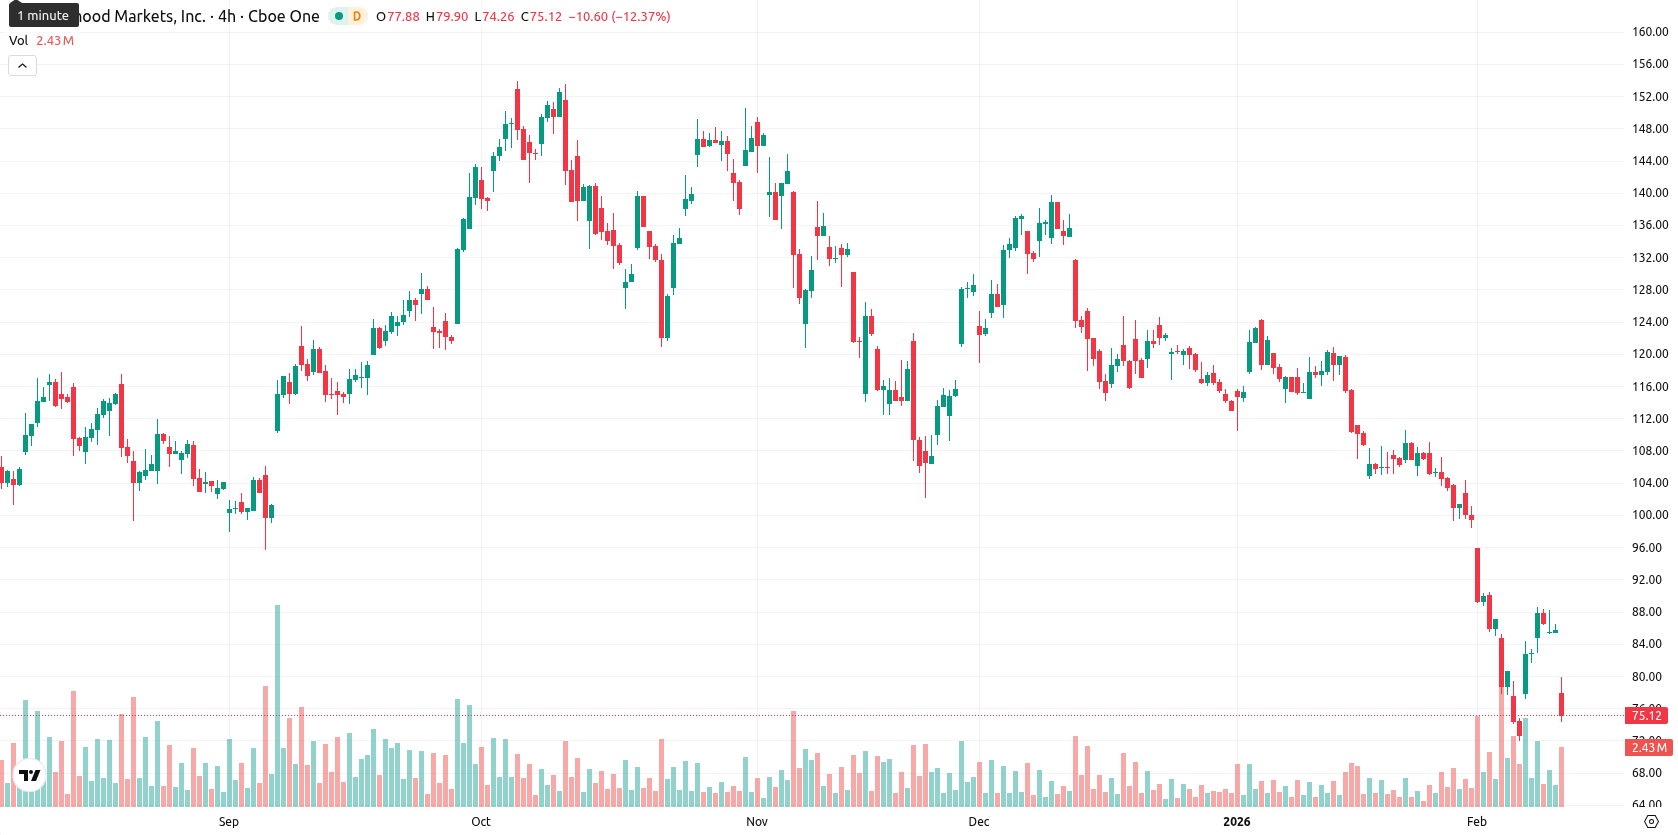
Robinhood Markets Inc (HOOD) is trading at $74.67 after a sharp daily loss of 12.77%, positioned far below the MA-20, MA-50, and MA-200, signaling strong seller control across all horizons.
Highlights
- Robinhood reported record full-year 2025 revenue of $4.5 billion and diluted EPS of $2.05, though Q4 revenue of $1.28 billion narrowly missed estimates.
- Transaction-based revenue rose 15% year-over-year in Q4 2025, driven by options and equities trading, while crypto trading revenue declined 38%.
- Technically, shares closed at $74.67, well below major moving averages, with downside risk to $72.00 and a low probability of rebound above $80.00.
Record annual earnings offset by crypto slump and revenue miss
Robinhood reported its fourth-quarter and full-year 2025 results, delivering record annual revenue of $4.5 billion, though fourth-quarter revenue of $1.28 billion narrowly missed Wall Street estimates. The company posted record diluted EPS of $2.05 for the year and $0.66 for the quarter, beating analyst expectations. Transaction-based revenue rose 15% year-over-year in the quarter, supported by growth in options and equities trading, while crypto trading revenue declined by 38%. Shiv Verma was also appointed Chief Financial Officer, effective February 6, 2026, following the prior CFO’s retirement.
Multiple sell signals amid sustained downside momentum and volatility
The current price of $74.67 trades far below the MA-20 ($99.28), MA-50 ($113.16), and MA-200 ($105.42), indicating sellers remain in control across short-, medium-, and long-term horizons. The closest dynamic resistance is the Ichimoku Kijun at $98.11, while moving average levels continue to signal significant overhead pressure. Momentum indicators show pronounced weakness: the MACD remains firmly negative and the ADX at 27.15 supports a strong directional downtrend. The Relative Strength Index and Commodity Channel Index are both in sell or oversold territories, the Stochastic RSI reads overbought but all intraday timeframes flash oversold, and Bull/Bear Power confirms seller dominance throughout the session. The Awesome Oscillator is neutral and does not contradict the downward move. The session opened sharply below the previous close, forming a distinct gap down, and the price is now trading near today’s range low amid high intraday volatility with heavy selling pressure after the open. Some divergence is visible across oscillators, but the combination of momentum and daily loss of 12.77% aligns closely with strong negative sentiment.
Limited rebound prospects as bearish outlook drives risk of further decline
Looking ahead, the expected trading range for the next week is set at $72.00 – $80.00, reflecting typical volatility around current levels. The probability of a price rebound is very low (less than 20%), with a pronounced bias toward further decline. The baseline scenario anticipates continued sideways movement within the $72.00 – $80.00 band. A bullish case would require a breakout above Ichimoku Kijun resistance at $98.11, which is unlikely in the current context, while a breakdown below $72.00 could open the way for additional downside.
Last time, analysts noted that Robinhood's stock has experienced a pronounced downtrend, with prices retreating sharply below key moving averages following disappointing earnings and a substantial drop in crypto trading revenue. Technical indicators such as RSI and MACD reflect ongoing bearish momentum, with the next significant support level being closely monitored as investors weigh the company's transition toward AI services and blockchain infrastructure.


Latest Robinhood News


-
 Afghanistan
-
 Albania
-
 Algeria
-
 Angola
-
 Argentina
-
 Armenia
-
 Australia
-
 Austria
-
 Azerbaijan
-
 Bahamas
-
 Bahrain
-
 Bangladesh
-
 Belarus
-
 Belgium
-
 Bolivia
-
 Botswana
-
 Brazil
-
 Brunei
-
 Bulgaria
-
 Cambodia
-
 Cameroon
-
 Canada
-
 Chile
Chile
-
 China
China
-
 Colombia
-
 Congo
Congo
-
 Costa Rica
-
 Cote d'Ivoire
-
 Croatia
-
 Cuba
Cuba
-
 Cyprus
-
 Czechia
-
 DR Congo
-
 Denmark
-
 Dominican Republic
-
 Ecuador
-
 Egypt
Egypt
-
 El Salvador
-
 Estonia
-
 Eswatini
-
 Ethiopia
-
 Finland
-
 France
-
 Georgia
-
 Germany
-
 Ghana
Ghana
-
 Greece
-
 Haiti
Haiti
-
 Hong Kong
-
 Hungary
-
 India
India
-
 Indonesia
-
 Iran, Islamic republic
-
 Iraq
Iraq
-
 Ireland
-
 Israel
-
 Italy
Italy
-
 Jamaica
-
 Japan
Japan
-
 Jordan
-
 Kazakhstan
-
 Kenya
Kenya
-
 Korea
Korea
-
 Kuwait
-
 Kyrgyzstan
-
 Laos
Laos
-
 Latvia
-
 Lebanon
-
 Lesotho
-
 Libya
Libya
-
 Lithuania
-
 Luxembourg
-
 Madagascar
-
 Malaysia
-
 Malta
Malta
-
 Mauritius
-
 Mexico
-
 Moldova
-
 Mongolia
-
 Montenegro
-
 Morocco
-
 Mozambique
-
 Myanmar
-
 Namibia
-
 Nepal
Nepal
-
 Netherlands
-
 New Zealand
-
 Nigeria
-
 North Macedonia
-
 Norway
-
 Oman
Oman
-
 Pakistan
-
 Palestine
-
 Panama
-
 Papua New Guinea
-
 Paraguay
-
 Peru
Peru
-
 Philippines
-
 Poland
-
 Portugal
-
 Puerto Rico
-
 Qatar
Qatar
-
 Reunion
-
 Romania
-
 Rwanda
-
 Saudi Arabia
-
 Serbia
-
 Singapore
-
 Slovakia
-
 Slovenia
-
 Somalia
-
 South Africa
-
 Spain
Spain
-
 Sri Lanka
-
 Sweden
-
 Switzerland
-
 Syria
Syria
-
 Taiwan
-
 Tajikistan
-
 Tanzania
-
 Thailand
-
 Trinidad and Tobago
-
 Tunisia
-
 Turkey
-
 UAE
UAE
-
 Uganda
-
 Ukraine
-
 United Kingdom
-
United States
-
 Uruguay
-
 Uzbekistan
-
 Venezuela
-
 Vietnam
-
 Yemen
Yemen
-
 Zambia
-
 Zimbabwe
- Forex
- Crypto
