
COST slips as overbought technicals and bullish momentum hold, with consolidation expected between $970 and $1,000 – weekly forecast

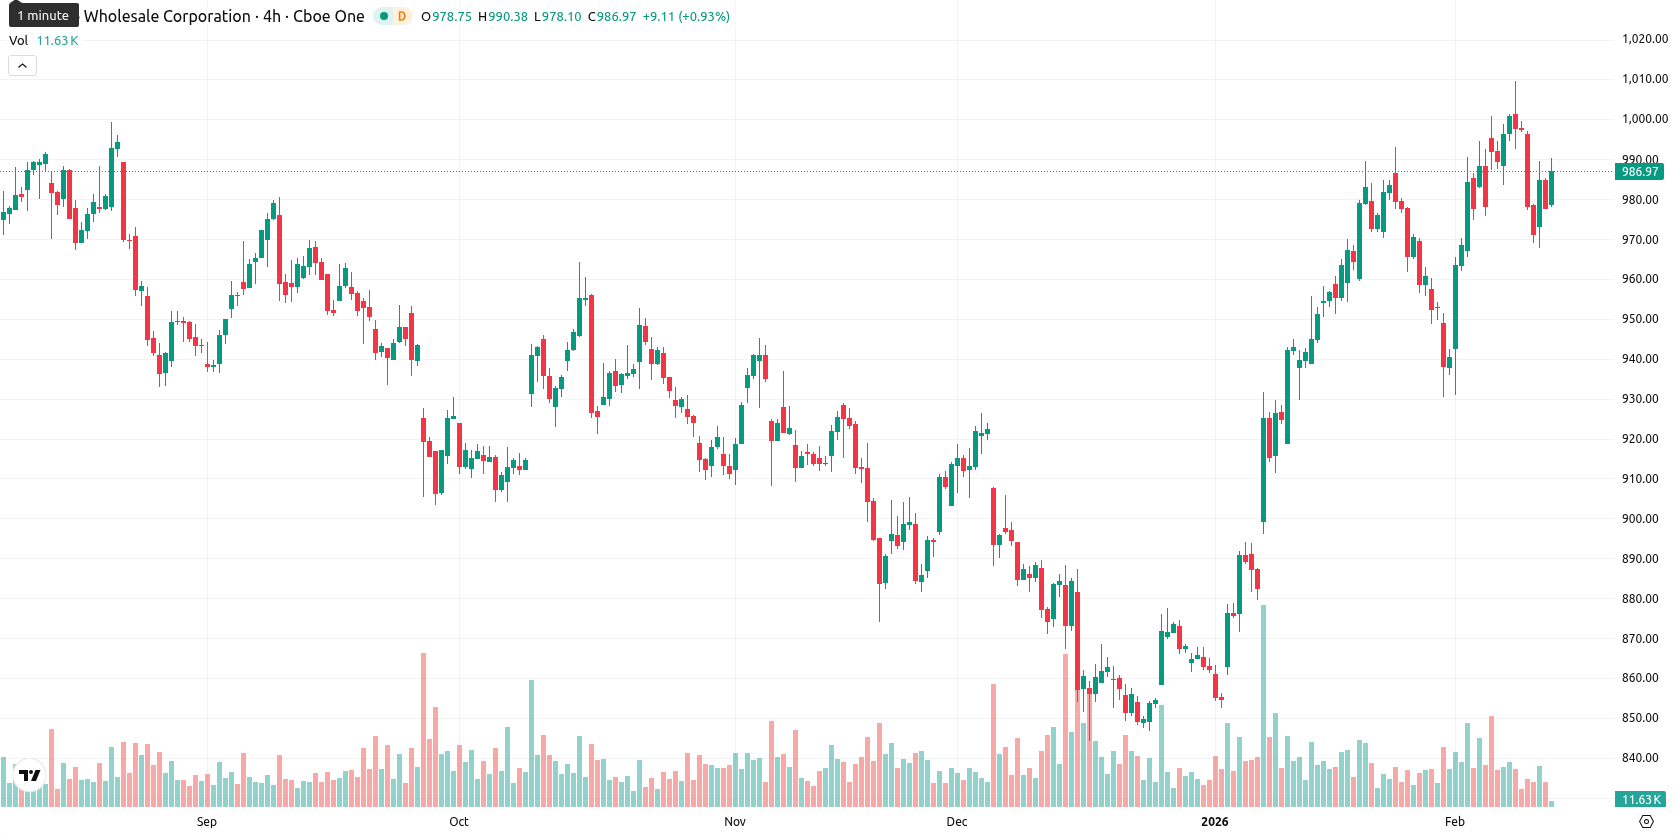
Costco Wholesale Corporation (COST) shares are currently trading at $991.21, marking a weekly movement higher and standing well above all major weekly moving averages: MA-20 at $972.14, MA-50 at $919.58, and MA-200 at $951.67. This positions Costco in a clear bullish trend on the weekly timeframe, reflecting sustained buying momentum and strong demand relative to both short- and long-term support levels.
Highlights
- Costco shares trade at $991.21, well above MA-20 ($972.14), MA-50 ($919.58), and MA-200 ($951.67), confirming strong bullish trends across all timeframes.
- Momentum indicators remain positive with MACD on a strong buy and ADX showing trend strength, but short-term oscillators like CCI and Stochastic RSI flag potential near-term fatigue.
- For the next 5 days, Costco is expected to consolidate between $970–$1,000, with an 80% probability of further upside, targeting $1,015 if momentum holds.
Positive sentiment deepens as earnings beat and strategic expansion drive flows
Costco reported a strong quarterly earnings beat, further strengthening its market position. The company expanded its same-day delivery service for members in France and Spain through a new partnership with Instacart and announced tighter membership-only access to food courts in international markets. Recent institutional investment activity added to the positive backdrop, with acquisitions by Caprock Group LLC and Advisors Asset Management Inc. Costco also declared a quarterly dividend of $1.30 per share, payable on February 13 to shareholders of record as of January 30.
Uptrend confirmed but overbought signals emerge amid strong technical momentum
On the weekly chart, COST is trading comfortably above its MA-20, MA-50, and MA-200, confirming strength across all key timeframes. The nearest dynamic support is set by the Ichimoku Kijun at $940.46, with notable resistance approaching the $1,000 level. Weekly momentum indicators remain positive: the MACD signals a strong buy, and the ADX points to robust trend strength. Weekly Stochastic RSI and Bull/Bear Power indicate overbought conditions, and some mixed signals from the CCI and Stochastic RSI reflect possible short-term fatigue, despite buyers maintaining control.
Upside bias persists this week as breakout risk increases near resistance
Looking ahead over the next 5–7 trading days, COST is expected to trade in a range of $970–$1,015, consistent with its established blue-chip dynamics. The probability of an upward move remains high, with a baseline expectation of consolidation between $970 and $1,000 as market participants vie for direction. A decisive break above $1,000 could trigger a test of $1,015 or higher if momentum persists, while a short-term pullback below $970 could see the price retest support at $950, though overall trends continue to favor buyers.
Previously it was reported that Costco remains in a strong bullish trend, trading above key short-, medium-, and long-term moving averages, with momentum indicators such as MACD and ADX signaling continued upward pressure. However, overbought readings on the RSI and CCI increase the risk of a near-term pullback, with key support seen at $930.80 and resistance near the $1,000 level.


-
 Afghanistan
-
 Albania
-
 Algeria
-
 Angola
-
 Argentina
-
 Armenia
-
 Australia
-
 Austria
-
 Azerbaijan
-
 Bahamas
-
 Bahrain
-
 Bangladesh
-
 Belarus
-
 Belgium
-
 Bolivia
-
 Botswana
-
 Brazil
-
 Brunei
-
 Bulgaria
-
 Cambodia
-
 Cameroon
-
 Canada
-
 Chile
Chile
-
 China
China
-
 Colombia
-
 Congo
Congo
-
 Costa Rica
-
 Cote d'Ivoire
-
 Croatia
-
 Cuba
Cuba
-
 Cyprus
-
 Czechia
-
 DR Congo
-
 Denmark
-
 Dominican Republic
-
 Ecuador
-
 Egypt
Egypt
-
 El Salvador
-
 Estonia
-
 Eswatini
-
 Ethiopia
-
 Finland
-
 France
-
 Georgia
-
 Germany
-
 Ghana
Ghana
-
 Greece
-
 Haiti
Haiti
-
 Hong Kong
-
 Hungary
-
 India
India
-
 Indonesia
-
 Iran, Islamic republic
-
 Iraq
Iraq
-
 Ireland
-
 Israel
-
 Italy
Italy
-
 Jamaica
-
 Japan
Japan
-
 Jordan
-
 Kazakhstan
-
 Kenya
Kenya
-
 Korea
Korea
-
 Kuwait
-
 Kyrgyzstan
-
 Laos
Laos
-
 Latvia
-
 Lebanon
-
 Lesotho
-
 Libya
Libya
-
 Lithuania
-
 Luxembourg
-
 Madagascar
-
 Malaysia
-
 Malta
Malta
-
 Mauritius
-
 Mexico
-
 Moldova
-
 Mongolia
-
 Montenegro
-
 Morocco
-
 Mozambique
-
 Myanmar
-
 Namibia
-
 Nepal
Nepal
-
 Netherlands
-
 New Zealand
-
 Nigeria
-
 North Macedonia
-
 Norway
-
 Oman
Oman
-
 Pakistan
-
 Palestine
-
 Panama
-
 Papua New Guinea
-
 Paraguay
-
 Peru
Peru
-
 Philippines
-
 Poland
-
 Portugal
-
 Puerto Rico
-
 Qatar
Qatar
-
 Reunion
-
 Romania
-
 Rwanda
-
 Saudi Arabia
-
 Serbia
-
 Singapore
-
 Slovakia
-
 Slovenia
-
 Somalia
-
 South Africa
-
 Spain
Spain
-
 Sri Lanka
-
 Sweden
-
 Switzerland
-
 Syria
Syria
-
 Taiwan
-
 Tajikistan
-
 Tanzania
-
 Thailand
-
 Trinidad and Tobago
-
 Tunisia
-
 Turkey
-
 UAE
UAE
-
 Uganda
-
 Ukraine
-
 United Kingdom
-
United States
-
 Uruguay
-
 Uzbekistan
-
 Venezuela
-
 Vietnam
-
 Yemen
Yemen
-
 Zambia
-
 Zimbabwe
- Forex
- Crypto
